Membership test: array versus dictionary
I guess this post is not going to reveal anything new: testing for an item’s membership in an array is slow, and dictionaries are much more CPU-efficient for that (albeit more RAM-hungry). I’m just restating the obvious here, plus showing some benchmarks.
Intro
Let’s define our problem first. We simply want to check whether some item (a string, number or whatever) is contained within some collection of items. For that, the simplest construct in [[Python (programming language)|Python]] would be:
if item in collection:
  do something
The above construct works regardless of “collection” being an array or a dictionary. However, the search for “item” in “collection” is different internally. In the case of a list, Python checks all its elements one by one, comparing them to “item”. If a match is found, True is returned, and the search aborted. For items not in the list, or appearing very late inside it, this search will take long.
However, in the case of dictionaries, the search is almost a one-step procedure: if collection[item] returns something other than an error, then item is in collection.
The tests
I’ve run two different test scripts, one for the array case, another for the dictionary case. In both cases I’ve searched for an item that was not in the collection, to maximize the searching efforts. The array script was as follows:
#!/usr/bin/python

import sys

nitems = int(sys.argv[1])

foo = []
bar = []

for i in range(nitems):
 foo.append(1)
 bar.append(2)

for i in foo:
  if i in bar:
    pass
Similarly, for dictionaries:
#!/usr/bin/python

import sys

nitems = int(sys.argv[1])

foo = {}
bar = {}

for i in range(nitems):
  j = i + nitems
  foo[i] = True
  bar[j] = True

for i in foo:
  if i in bar:
    pass
Both scripts accept (require) an integer number as argument, then build item collections of this size (initialization), then run the check loops. The loops are designed to look for every item of collection 1 in collection 2 (and all checks will fail, because no single item belongs to both sets).
Timing
The scripts were timed simply by measuring the execution [[wall clock time|walltime]] with the GNU time command, as follows:
Bear in mind that the computer was not otherwise idle during the tests. I was surfing the web with Firefox and listening to music with Amarok. Both programs are CPU- and (specially) memory-hungry, so take my results with a grain of salt. In any case, it was not my intention to get solid numbers, but just solid trends.
Memory profiling
I must confess my lack of knowledge around memory management of software, and how to profile it. I just used the [[Valgrind]] utility, with the massif tool, as follows:
% valgrind --tool=massif script nitems
Massif creates a log file (massif.out.pid) that contains “snapshots” of the process at different moments, and gives each of them a timestamp (the default timestamp being the number of instructions executed so far). The logged info that interests us is the [[dynamic memory allocation|heap]] size of the process. As far as I know (in my limited knowledge), this value corresponds to the RAM memory allotted to the process. This value can be digested out of the log file into a format suitable for printing heap size vs. execution time (instructions, really), by a Python script:
#!/usr/bin/python

import sys

try:
  fn = sys.argv[1]
except:
  sys.exit('Insert file name')

b2m = 1024*1024
e2m = 1000000

f = open(fn,'r')

for line in f:
  if 'time=' in line:
    aline = line.split('=')
    t     = aline[1].replace('\n','')
    t     = float(t)/e2m

  elif 'mem_heap_B' in line:
    aline = line.split('=')
    m     = aline[1].replace('\n','')
    m     = float(m)/b2m

    print t,m

f.close()
The above outputs heap MB vs million executions.
A much conciser form with [[AWK|awk]]:
% awk -F= '/time=/{t=$2/1000000};/mem_heap_B/{print t, $2/1048576}' massif.out.pid
Results
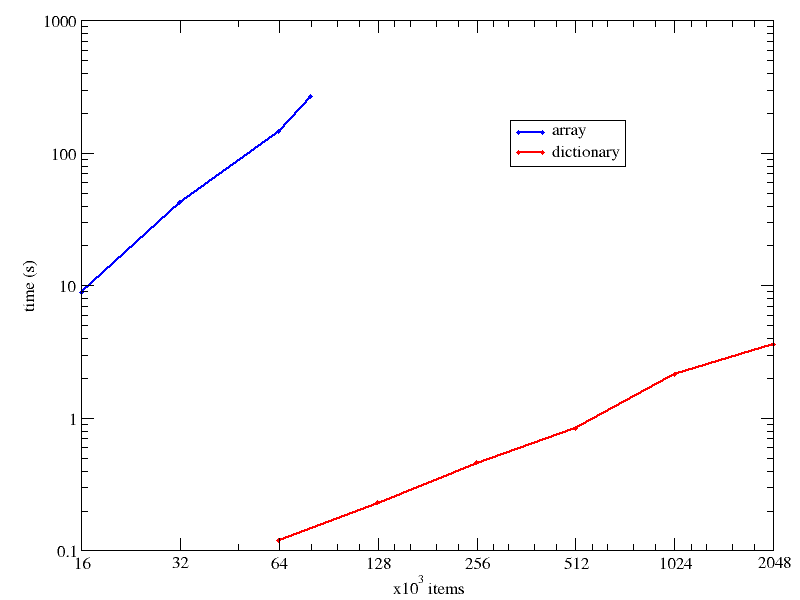
The execution times were so different, and the collection size (nitems) range so wide, I have used a [[logarithmic scale]] for both axes in the time vs collection size below:

At 64k items, the dictionary search is already 3 orders of magnitude faster, and the difference grows fast as the collection size increases.
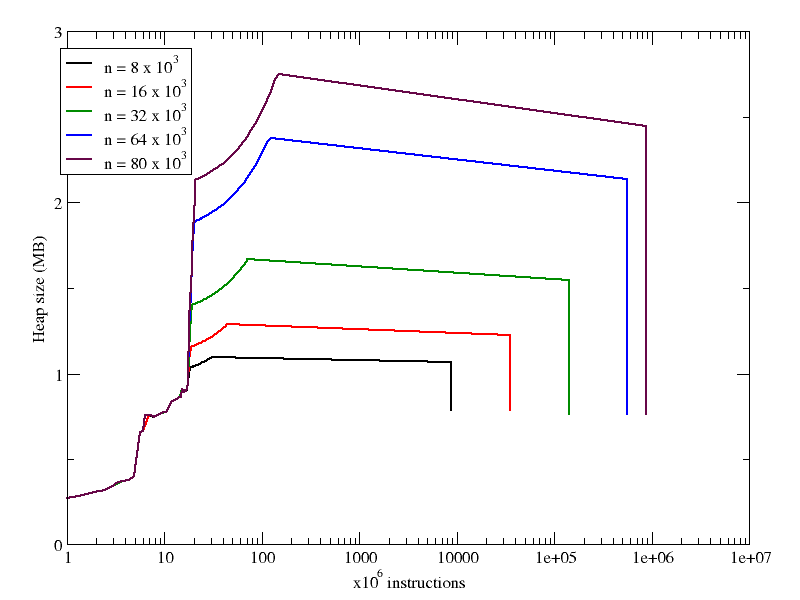
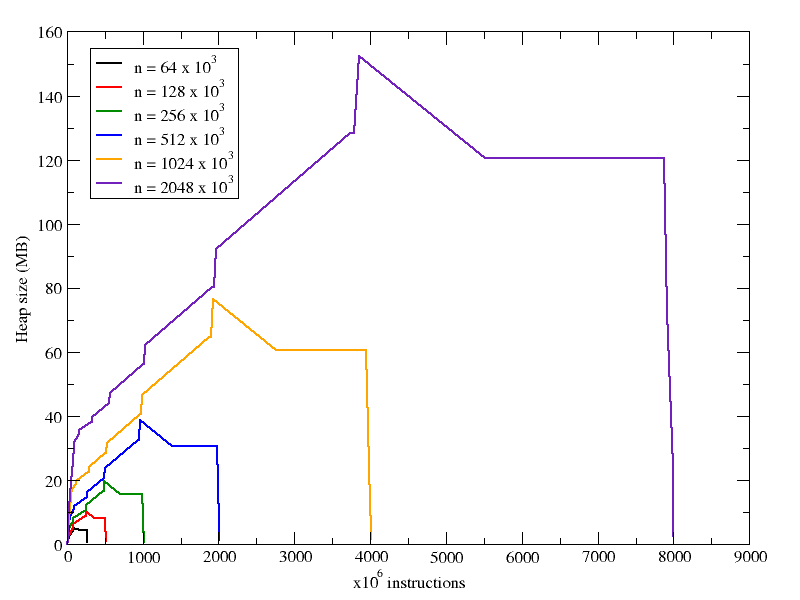
With respect to memory use, we can see that in both cases increasing nitems increases the heap size, but in the case of the arrays, the increase is not so pronounced. Looking at the X axes in both following plots, you can see that the number of instructions executed during the run grows linearly with the number of items in the collection (recall that the array plot has a logarithmic X axis).


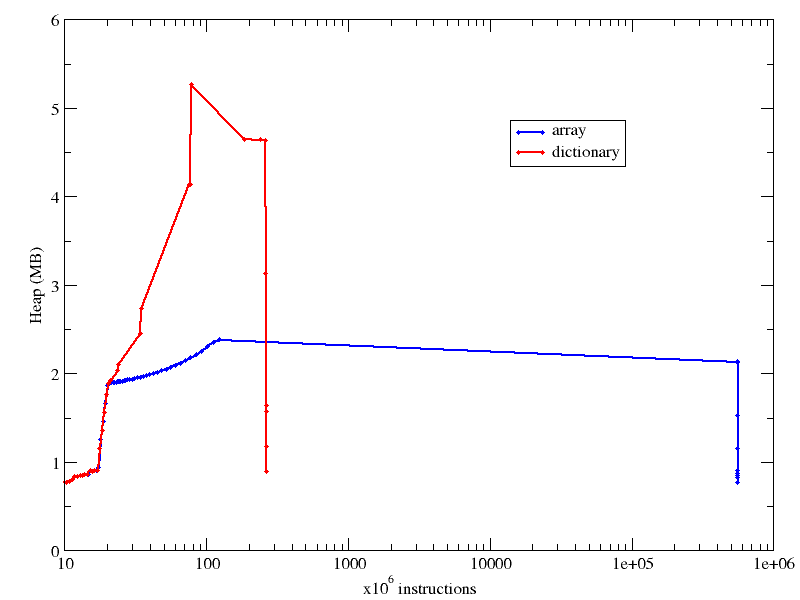
Finally, I compare memory usage of the array and dictionary case in the same plot, as you can see below, for the case of 64k items in the collection:

It wasn’t really an easy task, because I had to combine the biggest array case I could handle with the smallest dictionary the timing of which would be meaningful (smaller dictionaries would be equally “immediate”, according to time). Also notice how the X axis has a log scale. Otherwise the number of instructions in the array case would cross the right border of your monitor.
