April 13, 2010 at 10:03 am
· Filed under Free software and related beasts
I just received an e-mail with a very interesting text (recipies for [[Pincho|pintxos]]), and it prompted some experiment. The issue is that the text was inside of a [[DOC (computing)|DOC]] file (of course!), which rises some questions and concerns on my side. The size of the file was 471 kB.
I thought that one could make the document more portable by exporting it to [[PDF]] (using [[OpenOffice.org]]). Doing so, the resulting file has a size of 364 kB (1.29 times smaller than the original DOC).
Furthermore, text formatting could be waived, by using a [[plain text]] format. A copy/paste of the contents of the DOC into a TXT file yielded a 186 kB file (2.53x smaller).
Once in the mood, we can go one step further, and compress the TXT file: with [[gzip]] we get a 51 kb file (9.24x), and with [[xz]] a 42 kB one (11.2x)
So far, so good. No surprise. The surprise came when, just for fun, I exported the DOC to [[OpenDocument|ODT]]. I obtained a document equivalent to the original one, but with a 75 kB size! (6.28x smaller than the DOC).
So, for summarizing:
DOC
Pros
- Editable.
- Allows for text formatting.
Cons
- Proprietary. In principle only MS Office can open it. OpenOffice.org can, but because of reverse engineering.
- If opened with OpenOffice.org, or just a different version of MS Office, the reader can not be sure of seeing the same formatting the writer intended.
- Size. 6 times bigger than ODT. Even bigger than PDF.
- MS invented and owns it. You need more reasons?
PDF
Pros
- Portability. You can open it in any OS (Windows, Linux, Mac, BSD…), on account of there being so many free PDF readers.
- Smaller than the DOC.
- Allows for text formatting, and the format the reader sees will be exactly the one the writer intended.
Cons
- Not editable (I really don’t see the point in editing PDFs. For me the PDF is a product of an underlying format (e.g. LaTeX), as what you see on your browser is the product of some HTML/PHP, or an exe is the product of some source code. But I digress.)
- Could be smaller
TXT
Pros
- Portability. You can’t get much more portable than a plain text file. You can edit it anywhere, with your favorite text editor.
- Size. You can’t get much smaller than a plain text file (as it contains the mere text content), and you can compress it further with ease.
Cons
- Formatting. If you need text formatting, or including pictures or content other than text, then plain text is not for you.
ODT
Pros
- Portability. It can be edited with OpenOffice.org (and probably others), which is [[free software]], and has versions for Windows, Linux, and Mac.
- Editability. Every bit as editable as DOC.
- Size. 6 times smaller files than DOC.
- It’s a free standard, not some proprietary rubbish.
Cons
So please, if you send me some text, first consider if plain text will suffice. If not, and no edition is intended on my side, PDF is fine. If edition is important (or size, because it’s smaller than PDF), the ODT is the way to go.
Permalink
March 4, 2010 at 14:03 pm
· Filed under Free software and related beasts
This is a continuation post for my Linux World Domination project, started in this May 2008 post. You can read the previous post in the series here.
In the following data T2D means “time to domination” (the expected time for Windows/Linux shares to cross, counting from the present date). DT2D means difference (increase/decrease) in T2D, with respect to last report. CLP means “current Linux Percent”, as given by last logged data, and DD means domination day (in YYYY-MM-DD format), and DCLP means “difference in CLP”, with respect to last logged data.
| Project |
T2D |
DT2D |
DD |
CLP |
DCLP |
| Einstein |
already crossed |
– |
September 2009 |
54.80 |
+3.45 |
| MalariaControl |
>10 years |
– |
– |
12.12 |
+0.17 |
| PrimeGrid |
>10 years |
– |
– |
11.78 |
+1.47 |
| POEM |
>10 years |
– |
– |
11.52 |
+0.69 |
| Rosetta |
>10 years |
– |
– |
8.61 |
+0.01 |
| SETI |
>10 years |
– |
– |
8.12 |
+0.05 |
| QMC |
>10 years |
– |
– |
8.11 |
-0.12 |
| Spinhenge |
>10 years |
– |
– |
4.46 |
+0.09 |
The numbers (again) seem a bit discouraging, but the data is what it is. Now MalariaControl goes up (it went down in previous report), but QMC goes slightly down. All others go up. The Linux tide seems unstoppable, however its forward speed is not necessarily high.
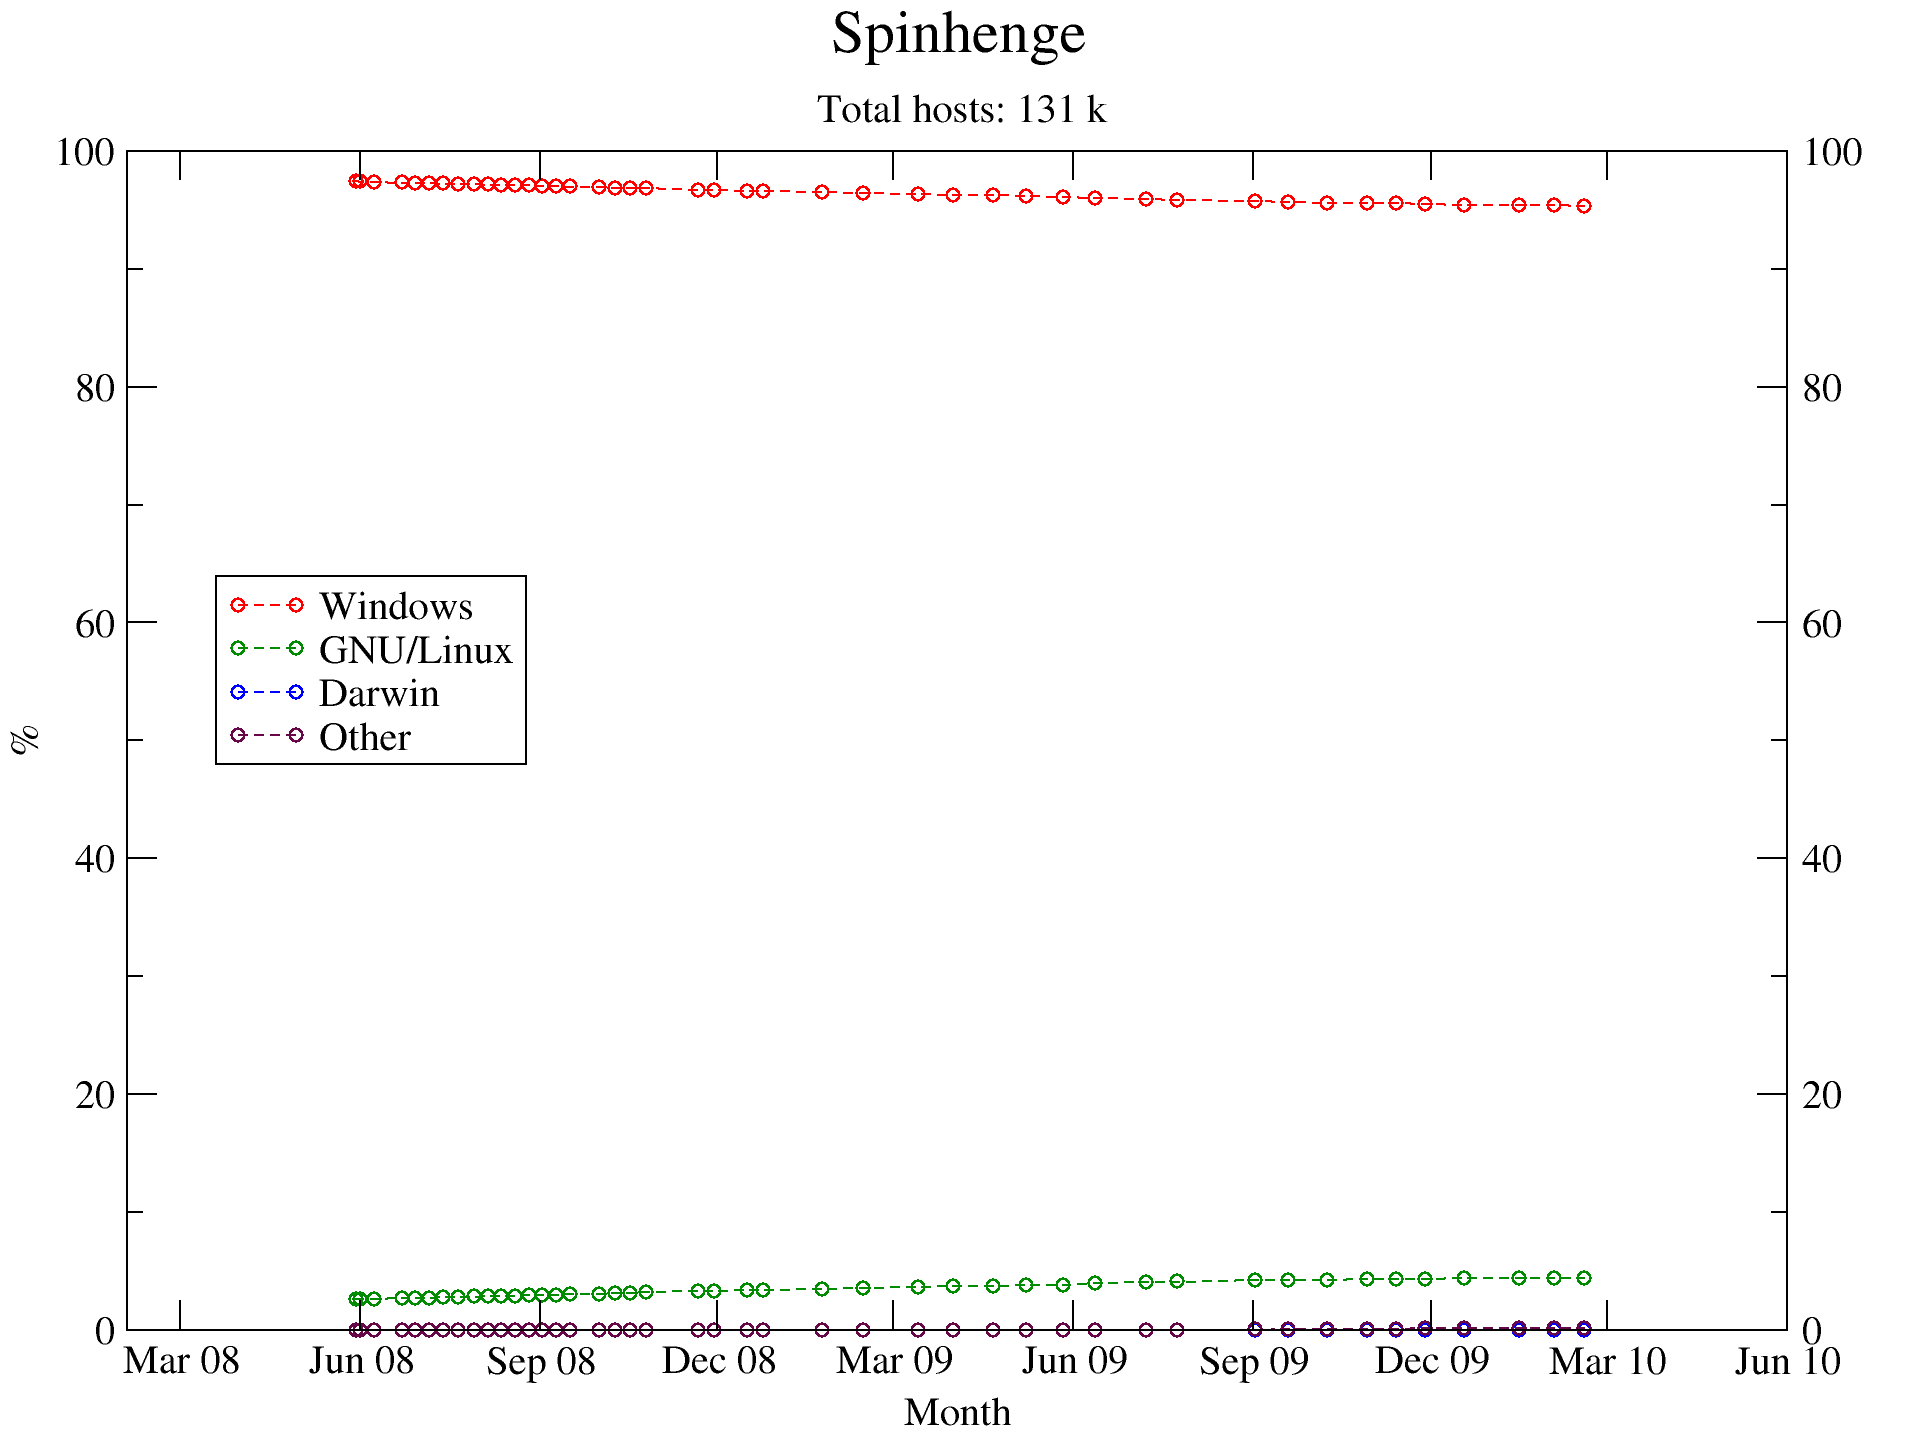
As promised, today I’m showing the plots for Spinhenge@home. In next issue, QMC@home.
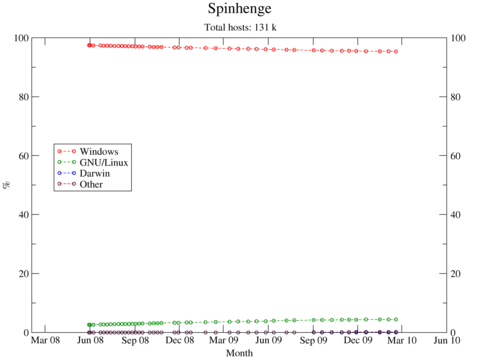
Number of hosts percent evolution for Spinhenge@home (click to enlarge)
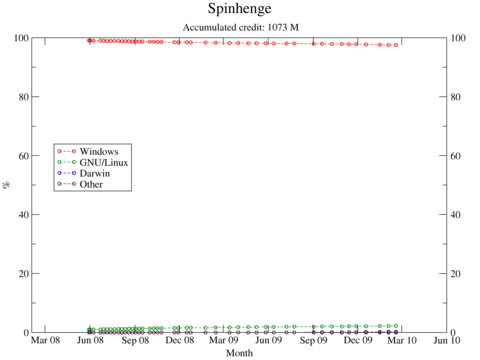
Accumulated credit percent evolution for Spinhenge@home (click to enlarge)
Permalink
December 3, 2009 at 16:44 pm
· Filed under Free software and related beasts
This is a continuation post for my Linux World Domination project, started in this May 2008 post. You can read the previous post in the series here.
In the following data T2D means “time to domination” (the expected time for Windows/Linux shares to cross, counting from the present date). DT2D means difference (increase/decrease) in T2D, with respect to last report. CLP means “current Linux Percent”, as given by last logged data, and DD means domination day (in YYYY-MM-DD format), and DCLP means “difference in CLP”, with respect to last logged data. I have dropped the “Confidence” column, for it gave little or no info.
| Project |
T2D |
DT2D |
DD |
CLP |
DCLP |
| Einstein |
already crossed |
– |
September 2009 |
51.35 |
+4.24 |
| MalariaControl |
>10 years |
– |
– |
11.95 |
-0.32 |
| POEM |
83.4 months |
– |
2016-10-08 |
11.52 |
+0.69 |
| PrimeGrid |
>10 years |
– |
– |
10.31 |
+0.46 |
| Rosetta |
>10 years |
– |
– |
8.60 |
+0.10 |
| QMC |
>10 years |
– |
– |
8.23 |
+0.15 |
| SETI |
>10 years |
– |
– |
8.07 |
+0.05 |
| Spinhenge |
>10 years |
– |
– |
4.37 |
+0.15 |
Except for the good news that Einstein@home has succumbed to the Linux hordes, the numbers (again) seem quite discouraging, but the data is what it is. All CLPs but MalariaControl have gone up (which goes down less than in previous report). The Linux tide seems unstoppable, however its forward speed is not necessarily high.
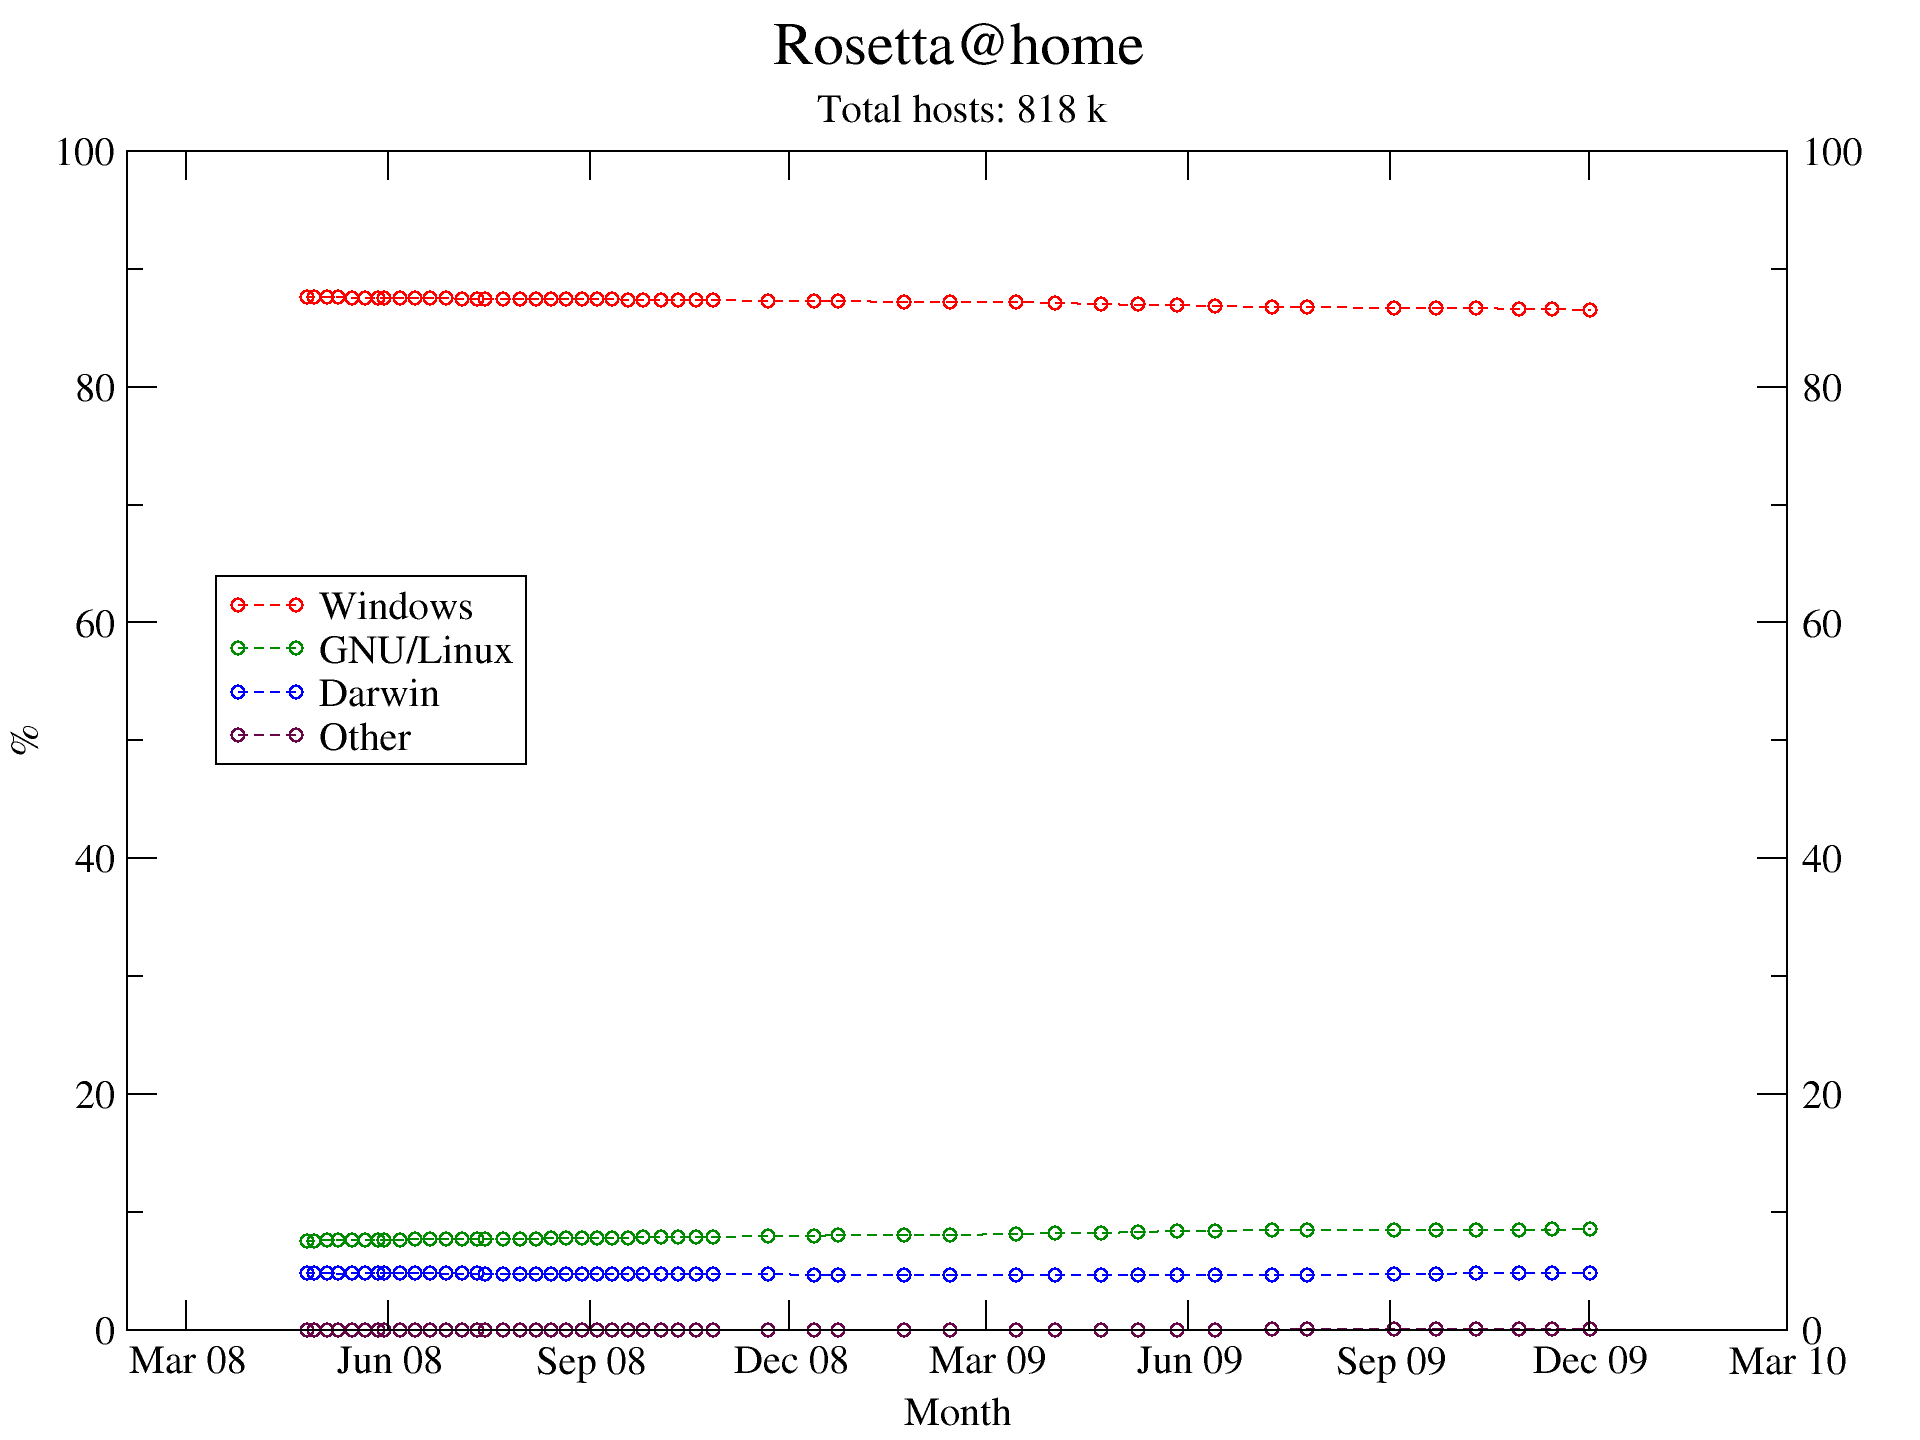
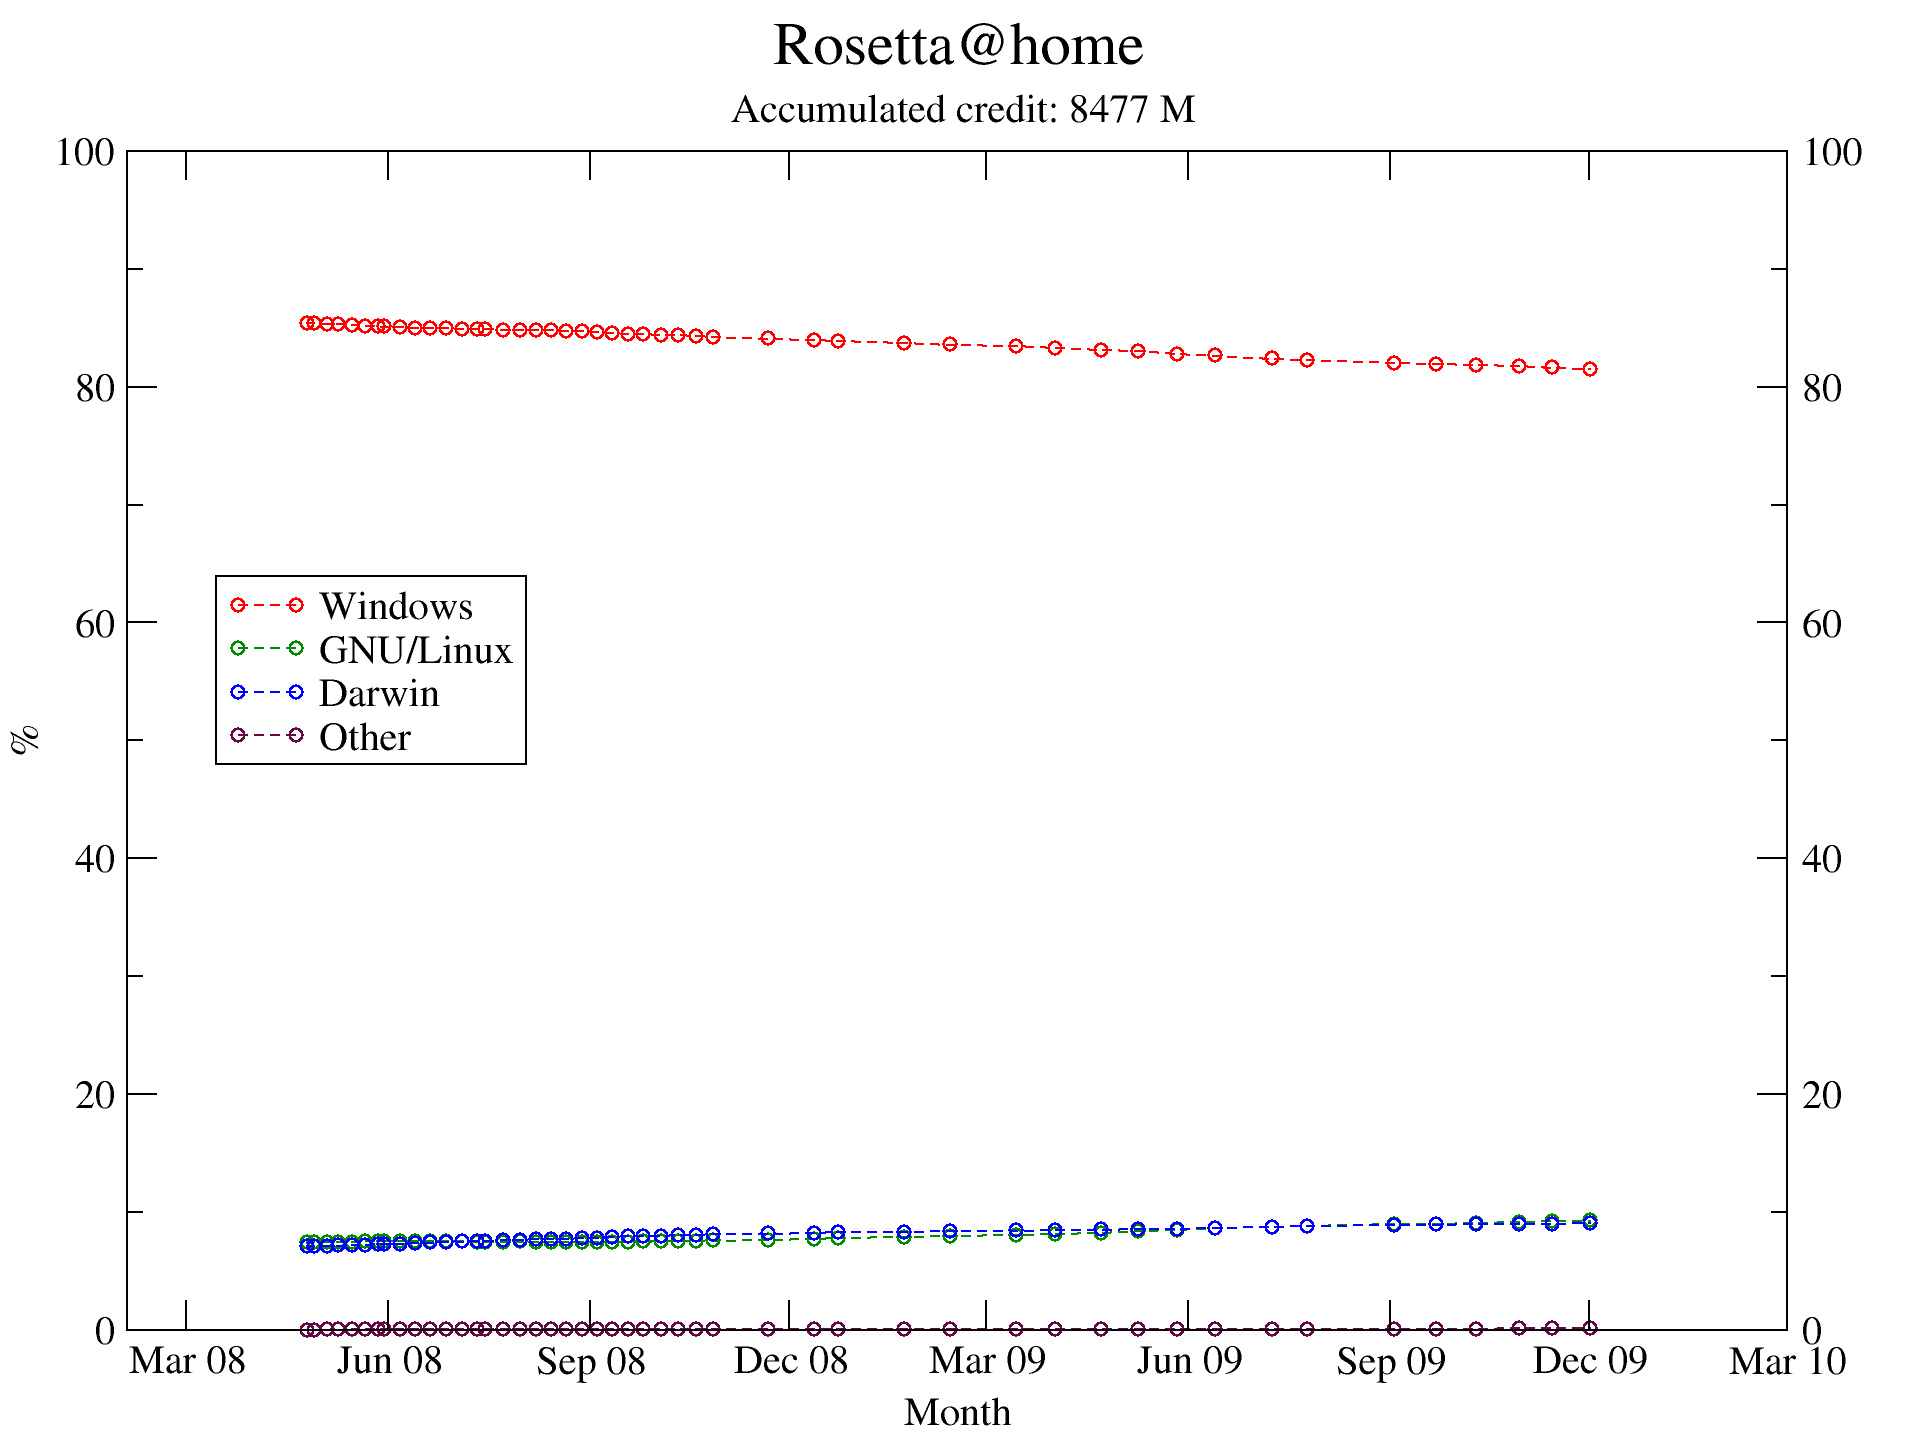
As promised, today I’m showing the plots for Rosetta@home, in next issue Spinhenge@home.

Number of hosts percent evolution for Rosetta@home (click to enlarge)

Accumulated credit percent evolution for Rosetta@home (click to enlarge)
Permalink
September 19, 2009 at 19:56 pm
· Filed under Free software and related beasts
I’ve read via Phoronix the case of the indie PC game producer Koonsolo, which sells a game for both Windows, Mac and Linux. The interesting thing is that, as you can read on Koonsolo’s blog, the Linux version is being sold in larger numbers than the Windows one!
Apparently a 40% of the visitors or the Koonsolo site use Windows, vs less than 23% for Linux. However, despite the majority of visitors using Windows (there are even more Mac visitors than Linux ones), the Linux version sales amount to a 34% of the total sales, whereas Windows sales are only 23%. Visit the site for some more numbers and comments.
Permalink
September 2, 2009 at 10:48 am
· Filed under Free software and related beasts
This is a continuation post for my Linux World Domination project, started in this May 2008 post. You can read the previous post in the series here.
In the following data T2D means “time to domination” (the expected time for Windows/Linux shares to cross, counting from the present date). DT2D means difference (increase/decrease) in T2D, with respect to last report. CLP means “current Linux Percent”, as given by last logged data, and DD means domination day (in YYYY-MM-DD format).
| Project |
T2D |
DT2D |
DD |
CLP |
Confidence % |
| Einstein |
38.6 days |
-55 days |
2009-10-10 |
47.11 (+2.60) |
16.1 |
| MalariaControl |
>10 years |
– |
– |
12.27 (-0.37) |
– |
| POEM |
>10 years |
– |
– |
10.83 (+0.17) |
– |
| PrimeGrid |
>10 years |
– |
– |
9.85 (+0.24) |
– |
| Rosetta |
>10 years |
– |
– |
8.50 (+0.13) |
– |
| QMC |
>10 years |
– |
– |
8.07 (+0.15) |
– |
| SETI |
>10 years |
– |
– |
8.02 (+0.02) |
– |
| Spinhenge |
>10 years |
– |
– |
4.22 (+0.37) |
– |
The numbers (again) seem quite discouraging, but the data is what it is. All CLPs but MalariaControl have gone up, with Spinhenge going up by almost a 0.4% in 3 months. The Linux tide seems unstoppable, however its forward speed is not necessarily high.
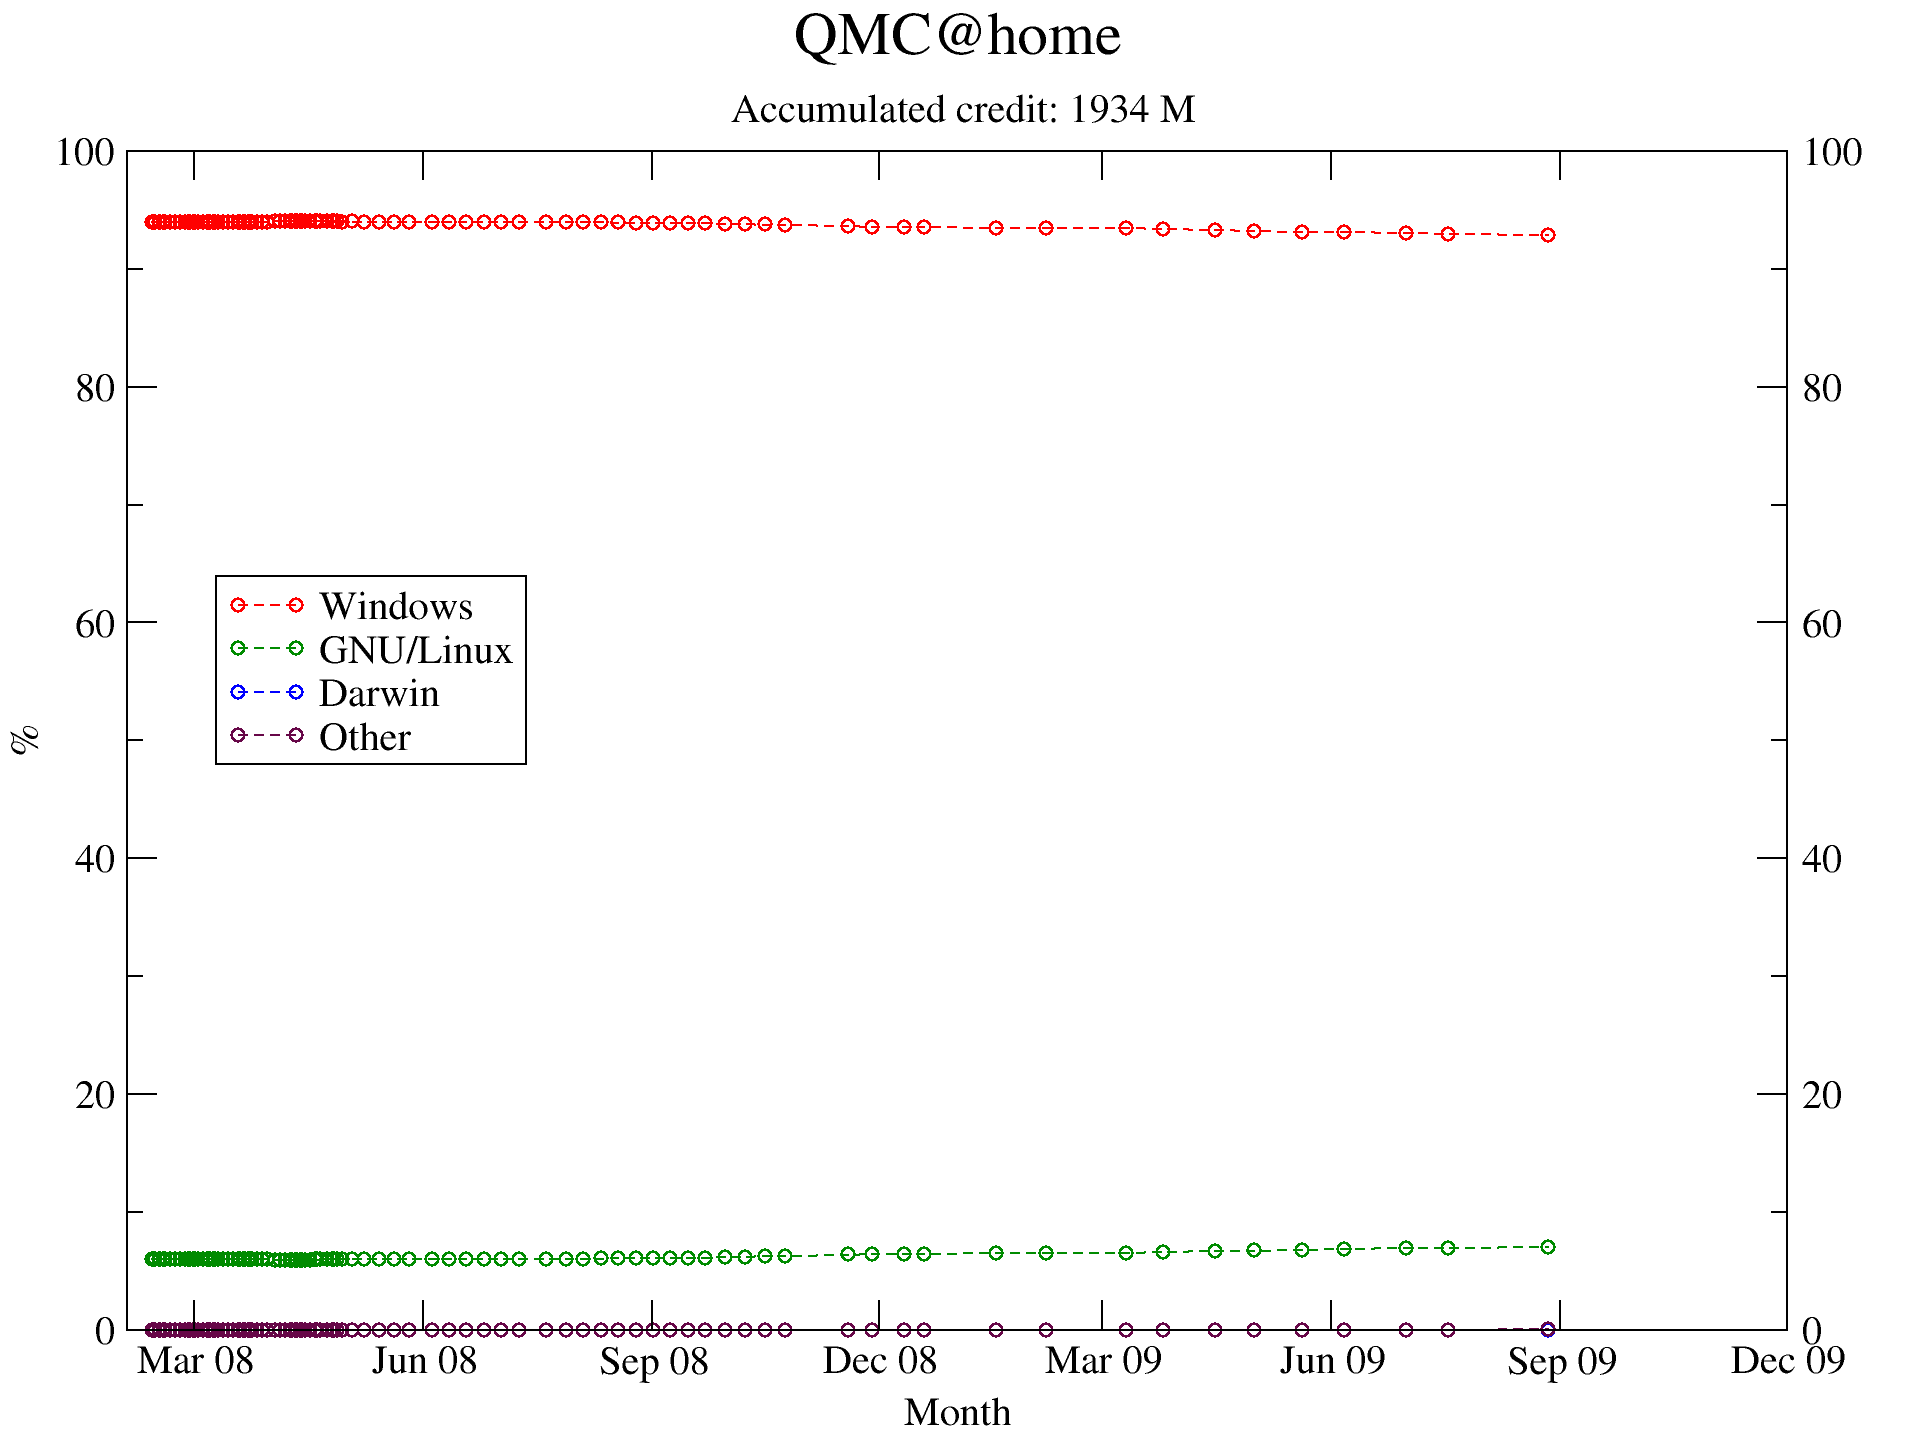
As promised, today I’m showing the plots for QMC@home, in next issue Rosetta@home.

Number of hosts percent evolution for QMC@home (click to enlarge)
Accumulated credit percent evolution for QMC”home (click to enlarge)
Permalink
June 2, 2009 at 12:37 pm
· Filed under Free software and related beasts
This is a continuation post for my Linux World Domination project, started in this May 2008 post. You can read the previous post in the series here.
In the following data T2D means “time to domination” (the expected time for Windows/Linux shares to cross, counting from the present date). DT2D means difference (increase/decrease) in T2D, with respect to last report. CLP means “current Linux Percent”, as given by last logged data, and DD means domination day (in YYYY-MM-DD format).
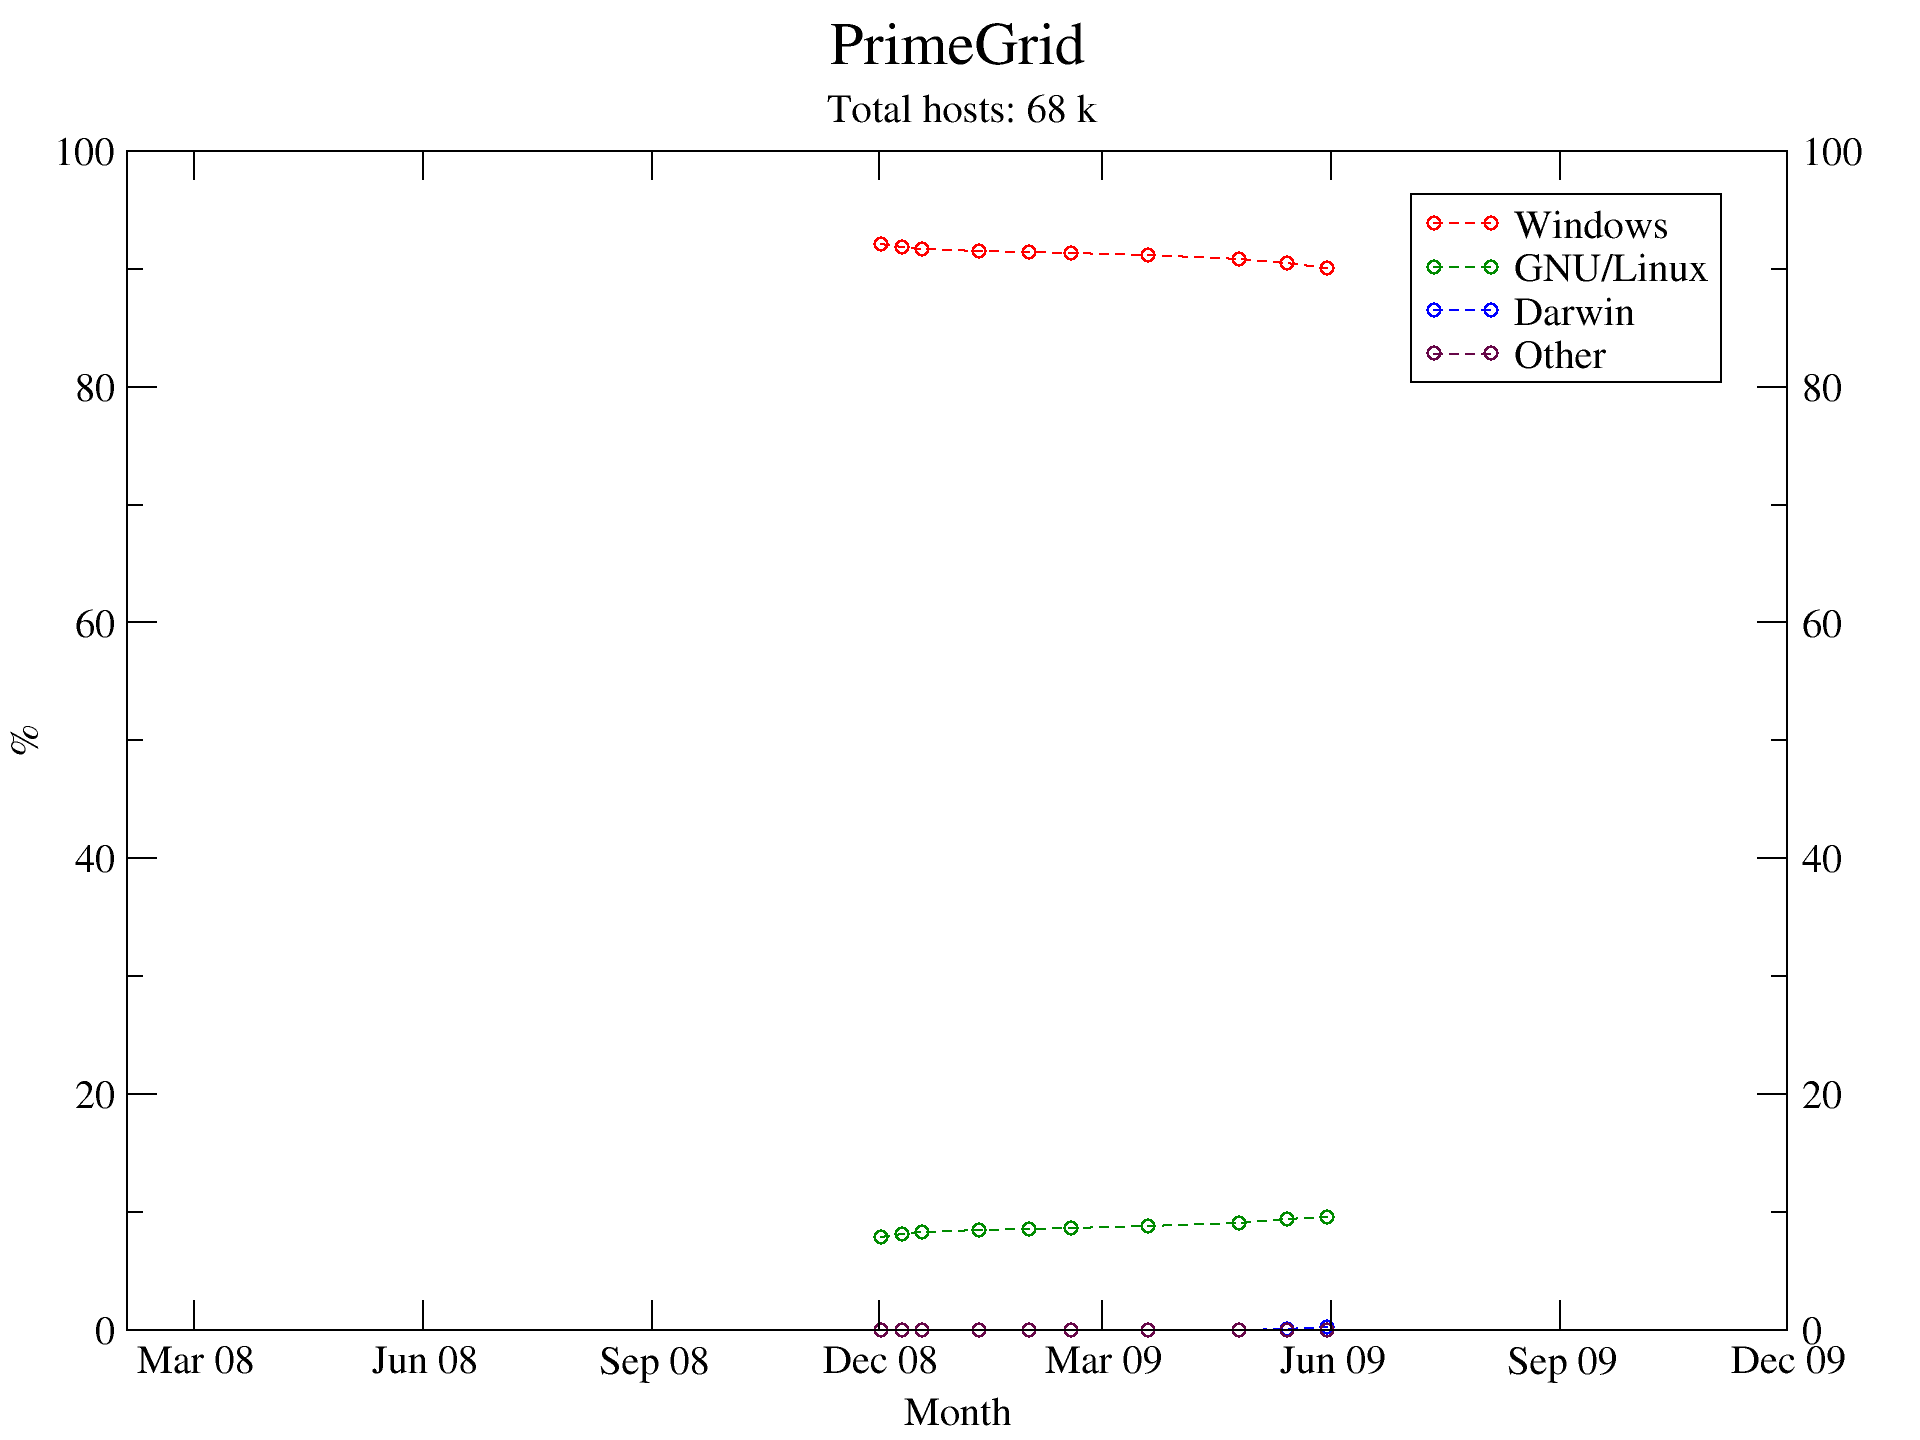
For the first time, data for [[PrimeGrid]] is included.
| Project |
T2D |
DT2D |
DD |
CLP |
Confidence % |
| Einstein |
4.5 months |
+3.5 months |
2009-10-14 |
44.51 (+2.42) |
6.4 |
| MalariaControl |
>10 years |
– |
– |
12.64 (+0.09) |
– |
| POEM |
>10 years |
– |
– |
10.66 (+0.19) |
– |
| PrimeGrid |
75 months |
– |
2015-07-22 |
9.61 |
1.3 |
| Rosetta |
>10 years |
– |
– |
8.37 (+0.28) |
– |
| QMC |
>10 years |
– |
– |
7.92 (+0.05) |
– |
| SETI |
>10 years |
– |
– |
8.00 (+0.06) |
– |
| Spinhenge |
>10 years |
– |
– |
3.87 (+0.28) |
– |
Mmm, the numbers seem quite discouraging, but the data is what it is. On the bright side, all CLPs have gone up, some almost a 0.3% in 3 months. The Linux tide seems unstoppable, however its forward speed is not necessarily high.
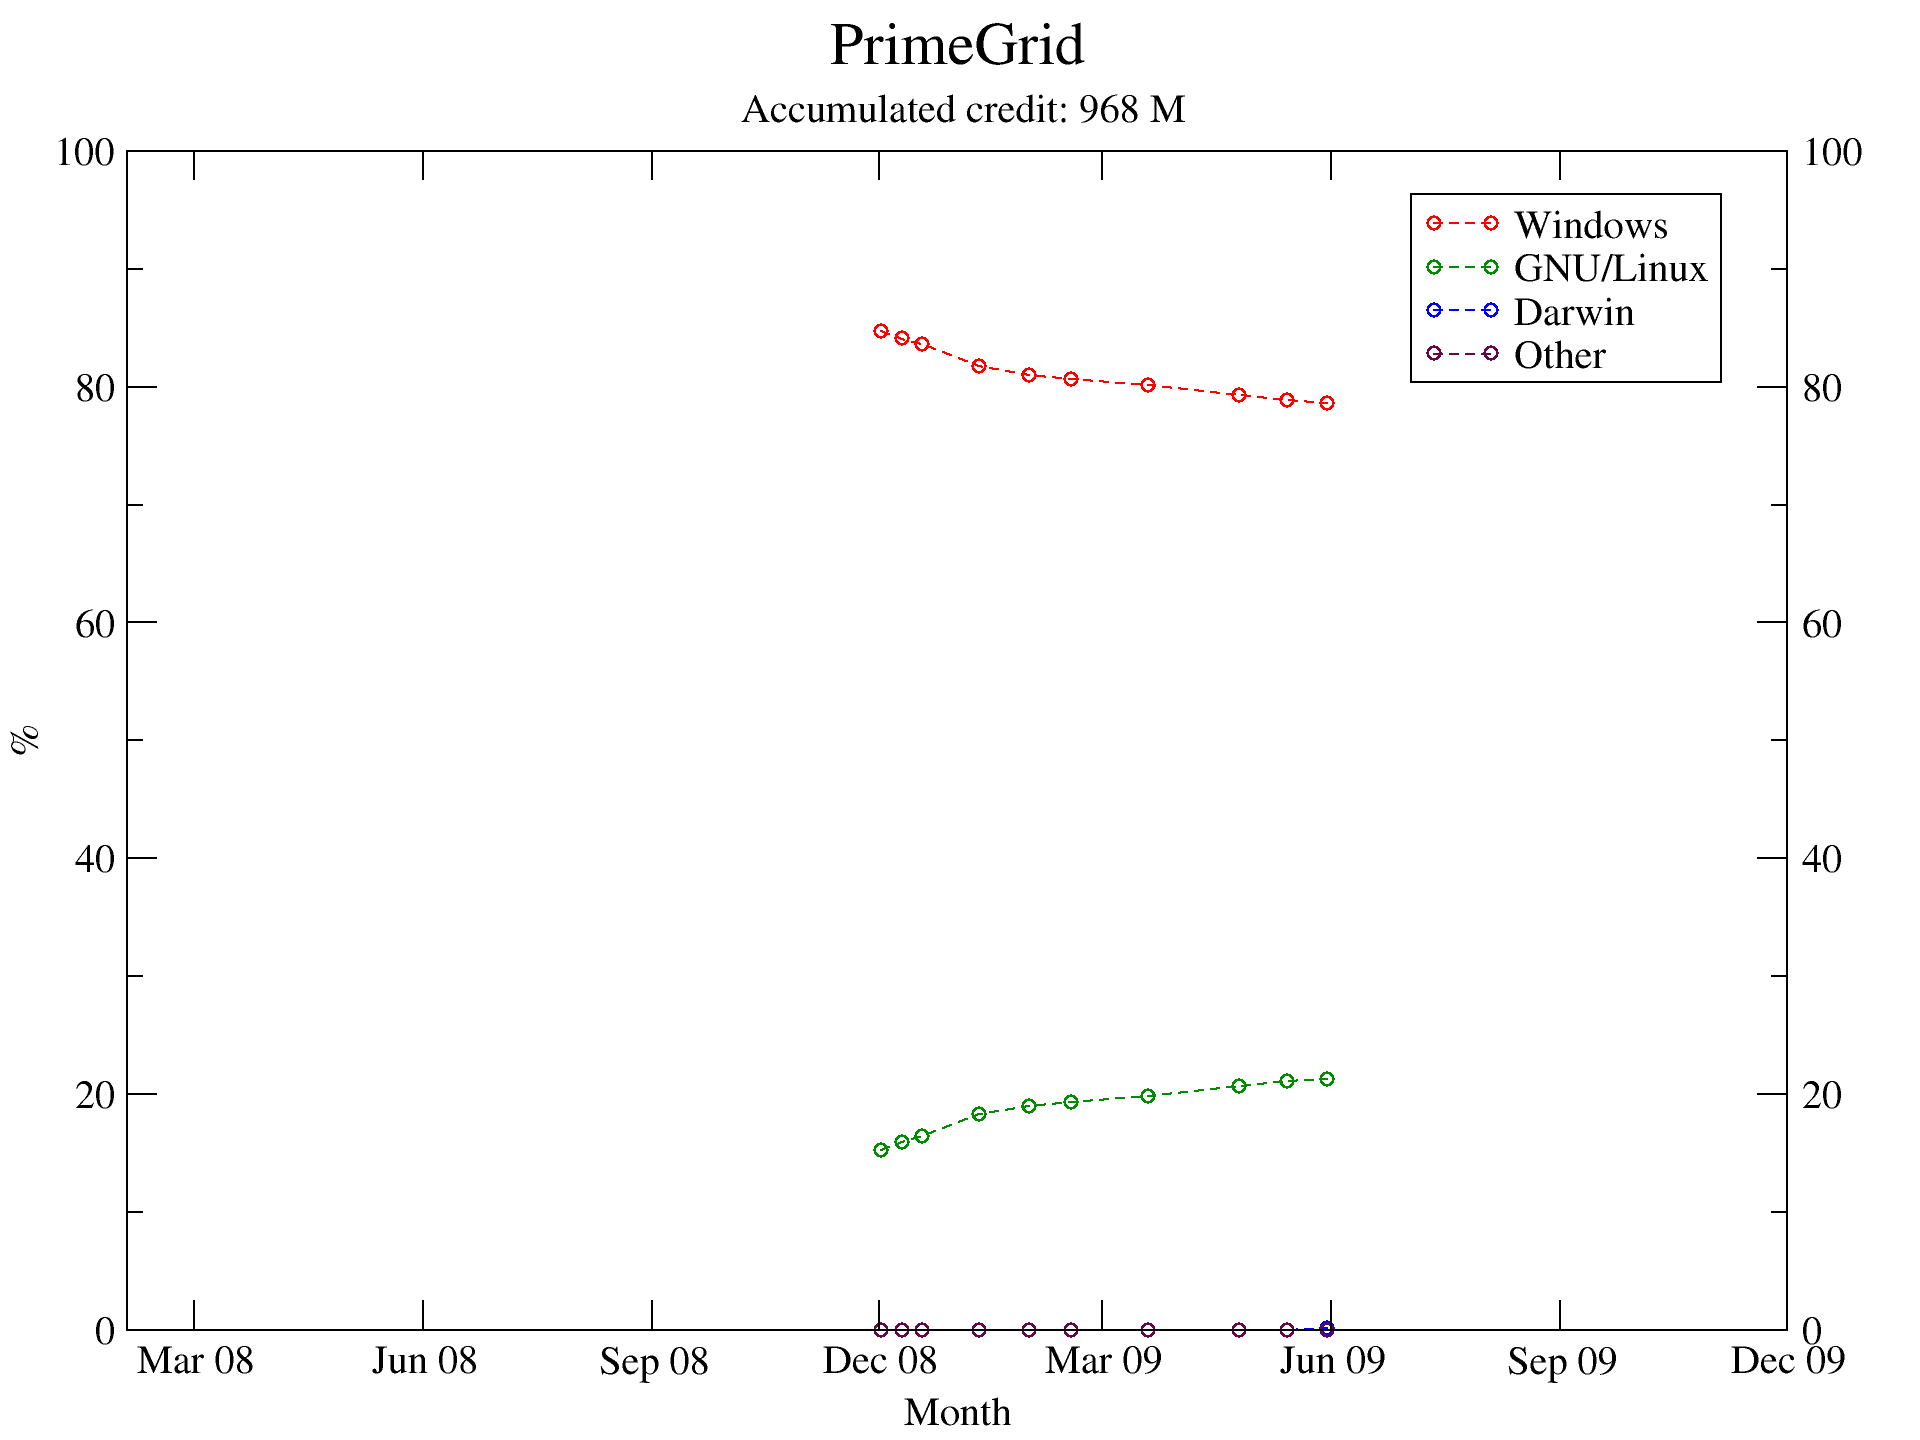
As promised, today I’m showing the plots for PrimeGrid, in next issue QMC@home.

Number of hosts percent evolution for PrimeGrid (click to enlarge)

Accumulated credit percent evolution for PrimeGrid (click to enlarge)
Permalink
March 12, 2009 at 14:37 pm
· Filed under Free software and related beasts
Did I say “bimonthly” in my last report? Mmm, that was 3 months ago… You can read an intro for my Linux World Domination project in this May 2008 post.
As usual D2D means “days to domination” (the expected time for Windows/Linux shares to cross, counting from the present date), and DD2D means difference (increase/decrease) in D2D, with respect to last report. CLP means “current Linux Percent”, as given by last logged data, and DD means domination day (in YYYY-MM-DD format).
| Project |
D2D |
DD2D |
DD |
CLP |
Confidence % |
| Einstein |
107 |
-144 |
2009-06-26 |
42.09 (+4.61) |
17.3 |
| MalariaControl |
>10k |
– |
– |
12.55 (+0.10) |
– |
| POEM |
5345 |
+325 |
2023-10-30 |
10.47 (+0.42) |
2.5 |
| Rosetta |
>10k |
– |
– |
8.09 (+0.10) |
– |
| QMC |
>10k |
– |
– |
7.87 (-0.04) |
– |
| SETI |
>10k |
– |
– |
7.94 (+0.06) |
– |
| Spinhenge |
>10k |
– |
– |
3.59 (+0.24) |
– |
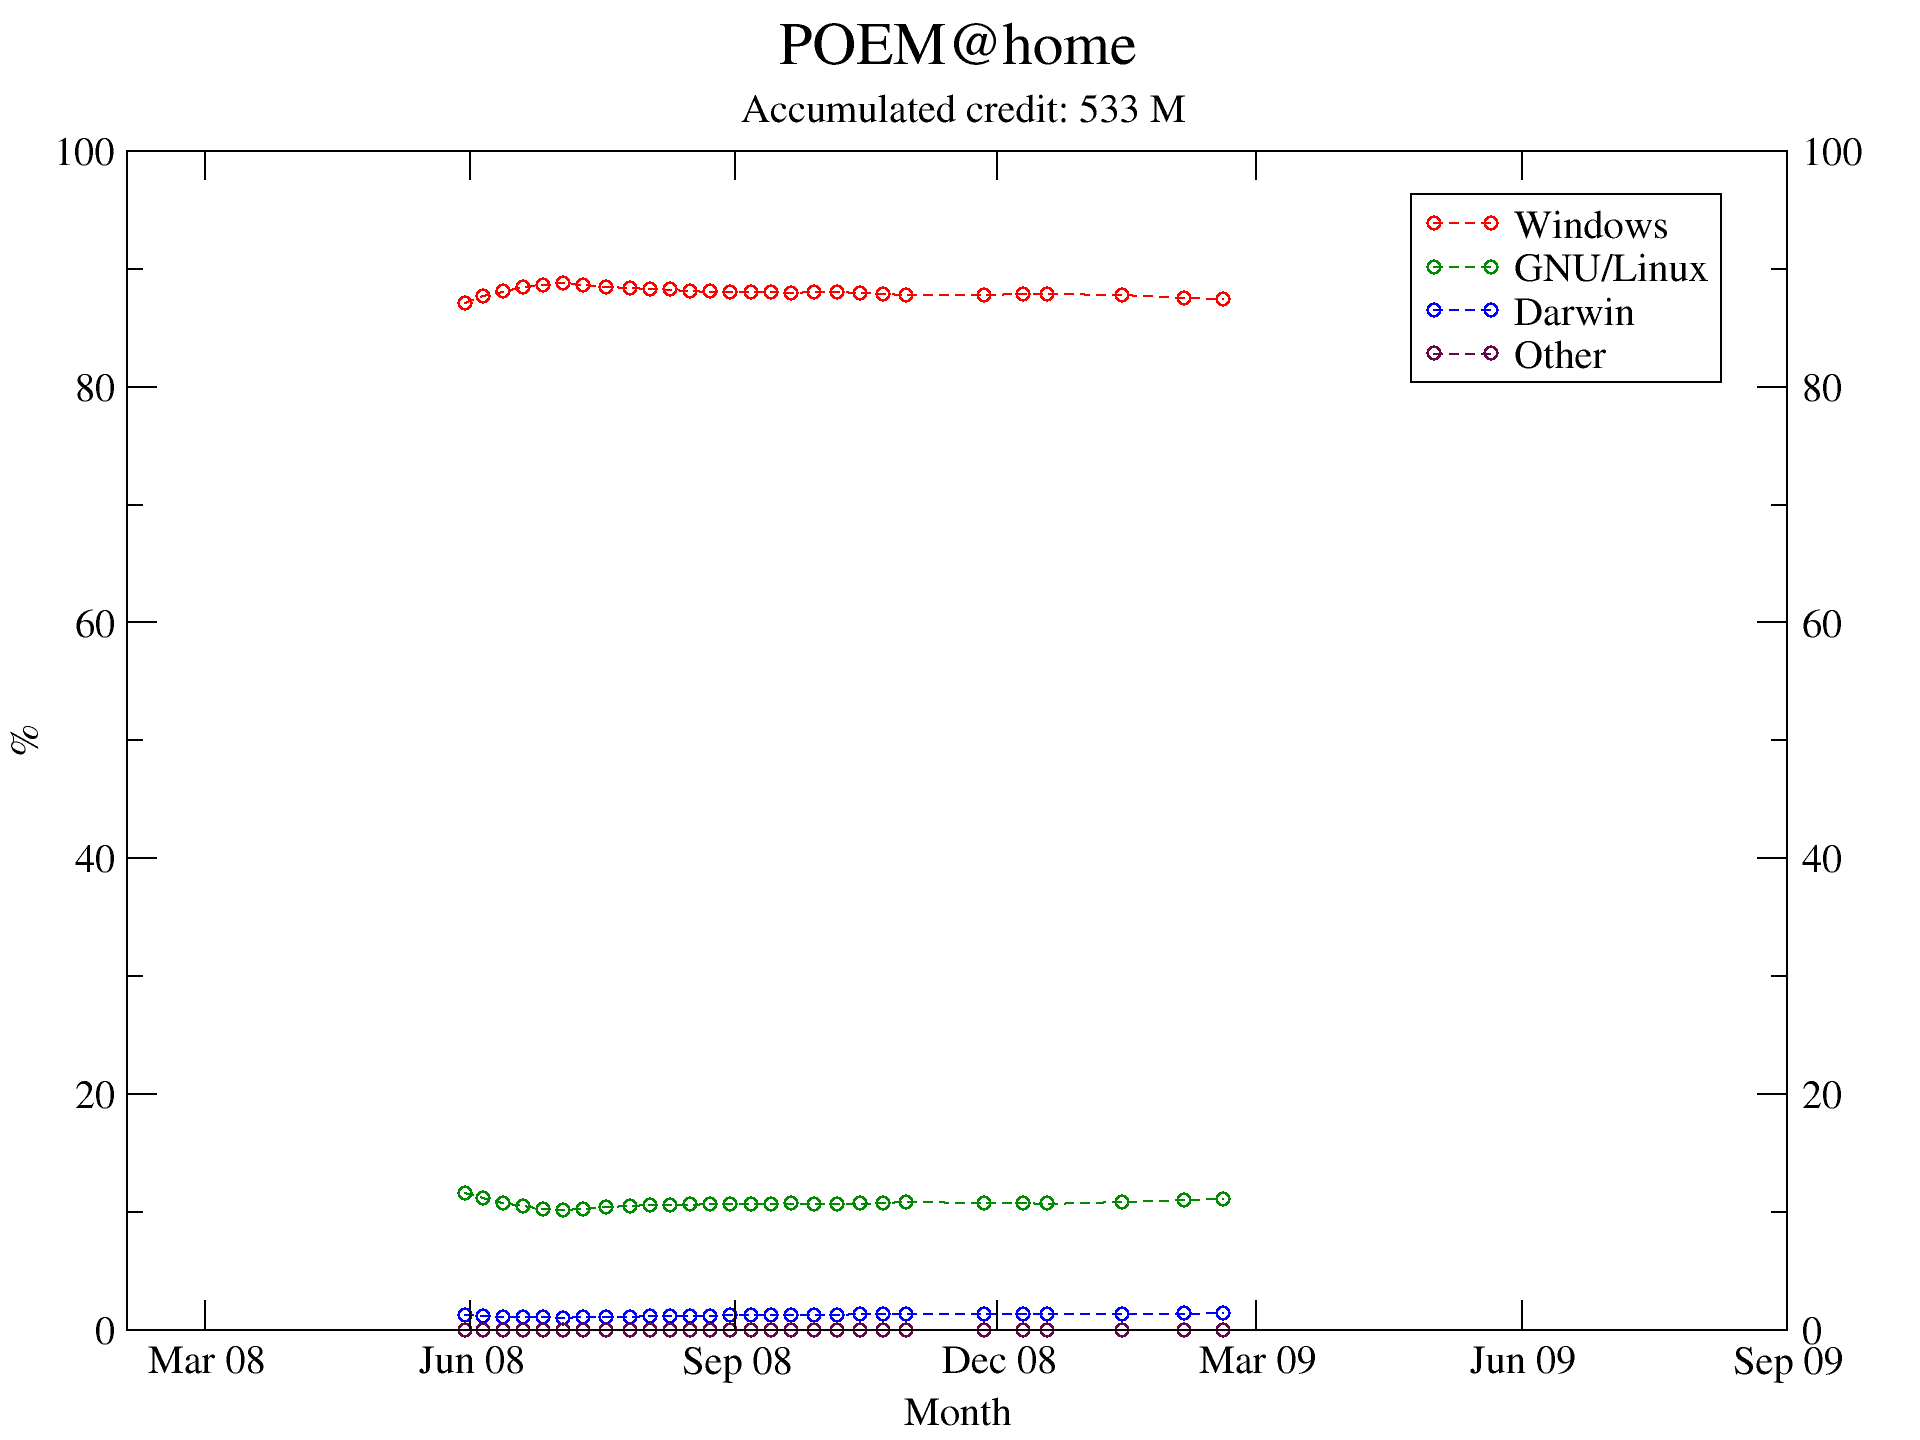
As promised, today I’m showing the plots for POEM@home, in next issue Prime@home.

Number of hosts percent evolution for POEM@home (click to enlarge)

Accumulated credit percent evolution for POEM@home (click to enlarge)
Permalink
March 3, 2009 at 12:09 pm
· Filed under Free software and related beasts
Right now I’m in the 4th EGEE User Forum/OGF25 conference being held in Catania, Sicily.
I have some random thought to write down, and my lately little-attended blog seems the right place to do so.
Random thought of the moment: everyone, I mean every boy and girl and their pets, has a laptop. Everyone listens to talks with a laptop in their knees. Also, an amazing fraction of these (from 1 in 4 to 1 in 3, maybe) are Macs. The Linux machines are also relatively abundant, although a sad majority of laptops seems to run Windows.
Might this mean that techies favor Apple? Maybe it just means that geeks can also be posh, as shown by the equally high amount of iPhones I’ve seen around.
Permalink
December 2, 2008 at 20:31 pm
· Filed under Free software and related beasts
I will start making this section bimonthly, otherwise the only content of my blog will consist on it. Besides, the new information generation rate is not enough to require more often updates.
You can read an intro for my Linux World Domination project in this May 2008 post.
As usual D2D means “days to domination” (the expected time for Windows/Linux shares to cross, counting from the present date), and DD2D means difference (increase/decrease) in D2D, with respect to last report. CLP means “current Linux Percent”, as given by last logged data, and DD means domination day (in YYYY-MM-DD format).
| Project |
D2D |
DD2D |
DD |
CLP |
Confidence % |
| Einstein |
250.8 |
-631.3 |
2009-08-09 |
37.48 (+2.31) |
9.5 |
| MalariaControl |
7172.8 |
+282.8 |
2028-07-22 |
12.45 (+0.19) |
0.8 |
| POEM |
5020.4 |
+1406.5 |
2022-08-31 |
10.05 (+0.26) |
1.1 |
| QMC |
>10k |
– |
– |
7.91 (+0.03) |
– |
| Rosetta |
>10k |
– |
– |
7.99 (+0.08) |
– |
| SETI |
>10k |
– |
– |
7.88 (+0.02) |
– |
| Spinhenge |
>10k |
– |
– |
3.35 (+0.14) |
– |
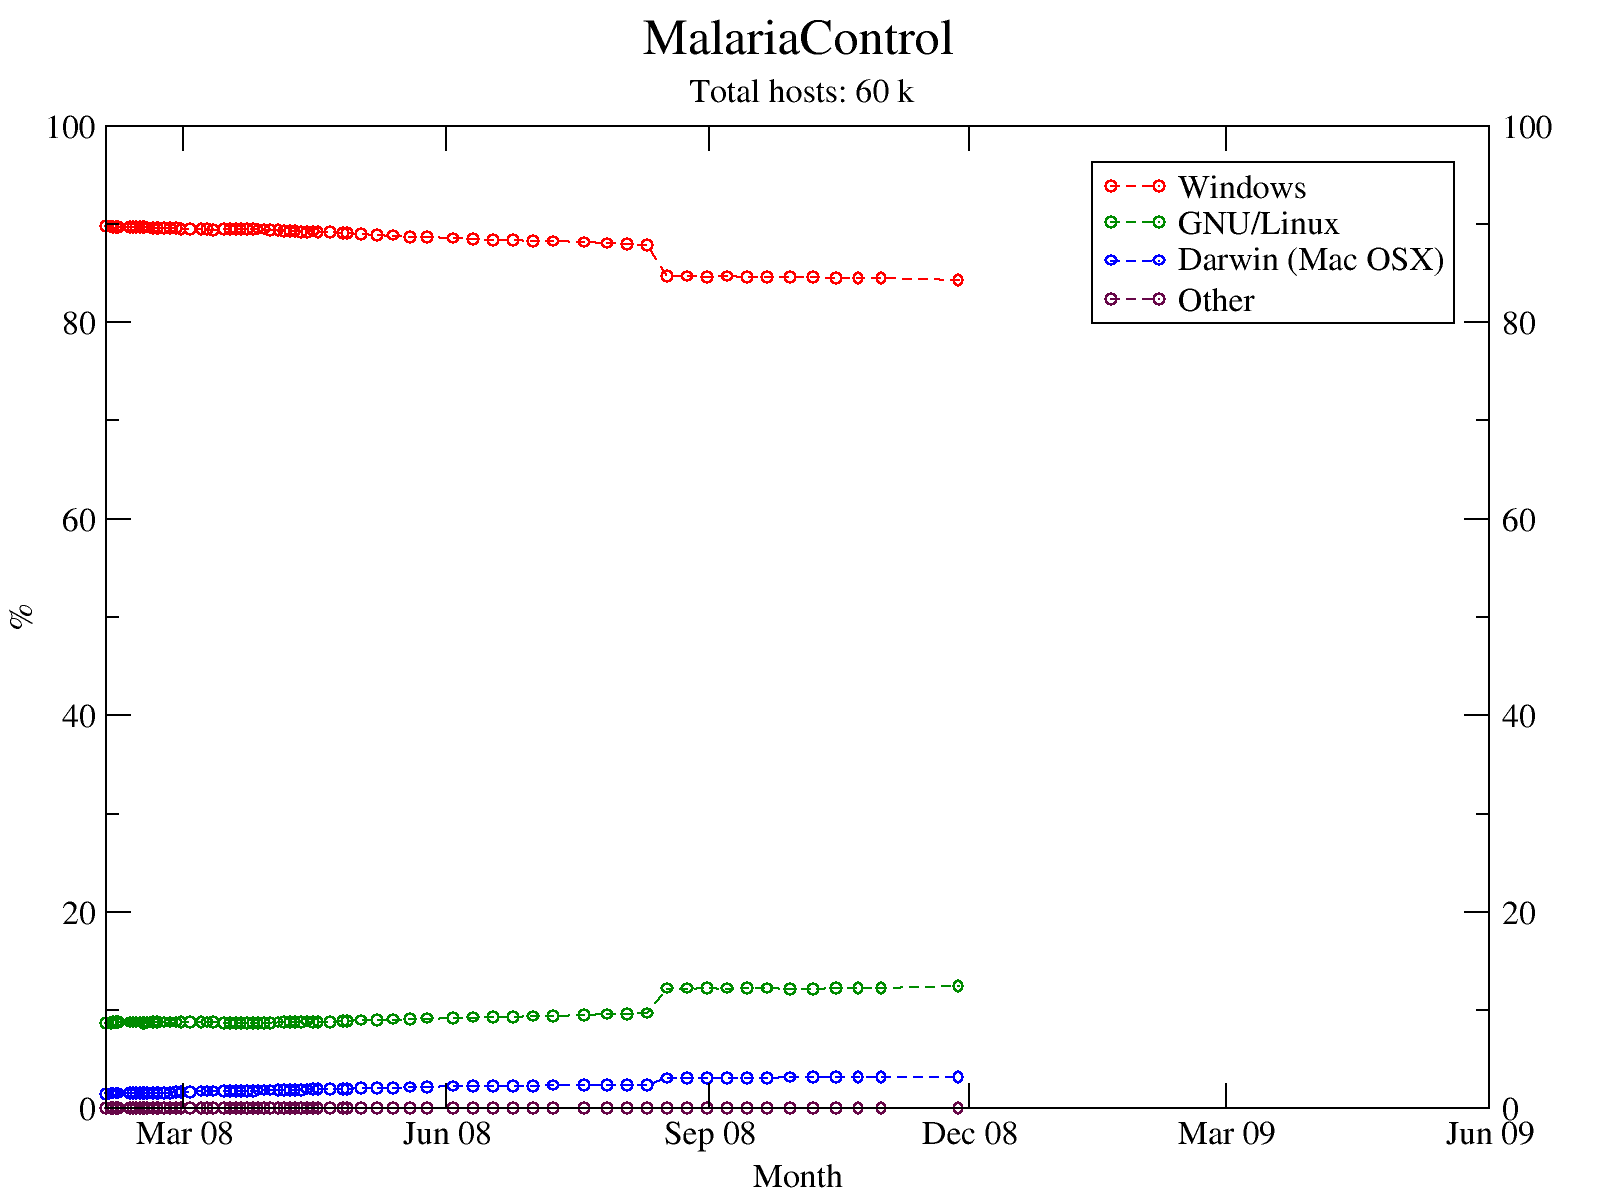
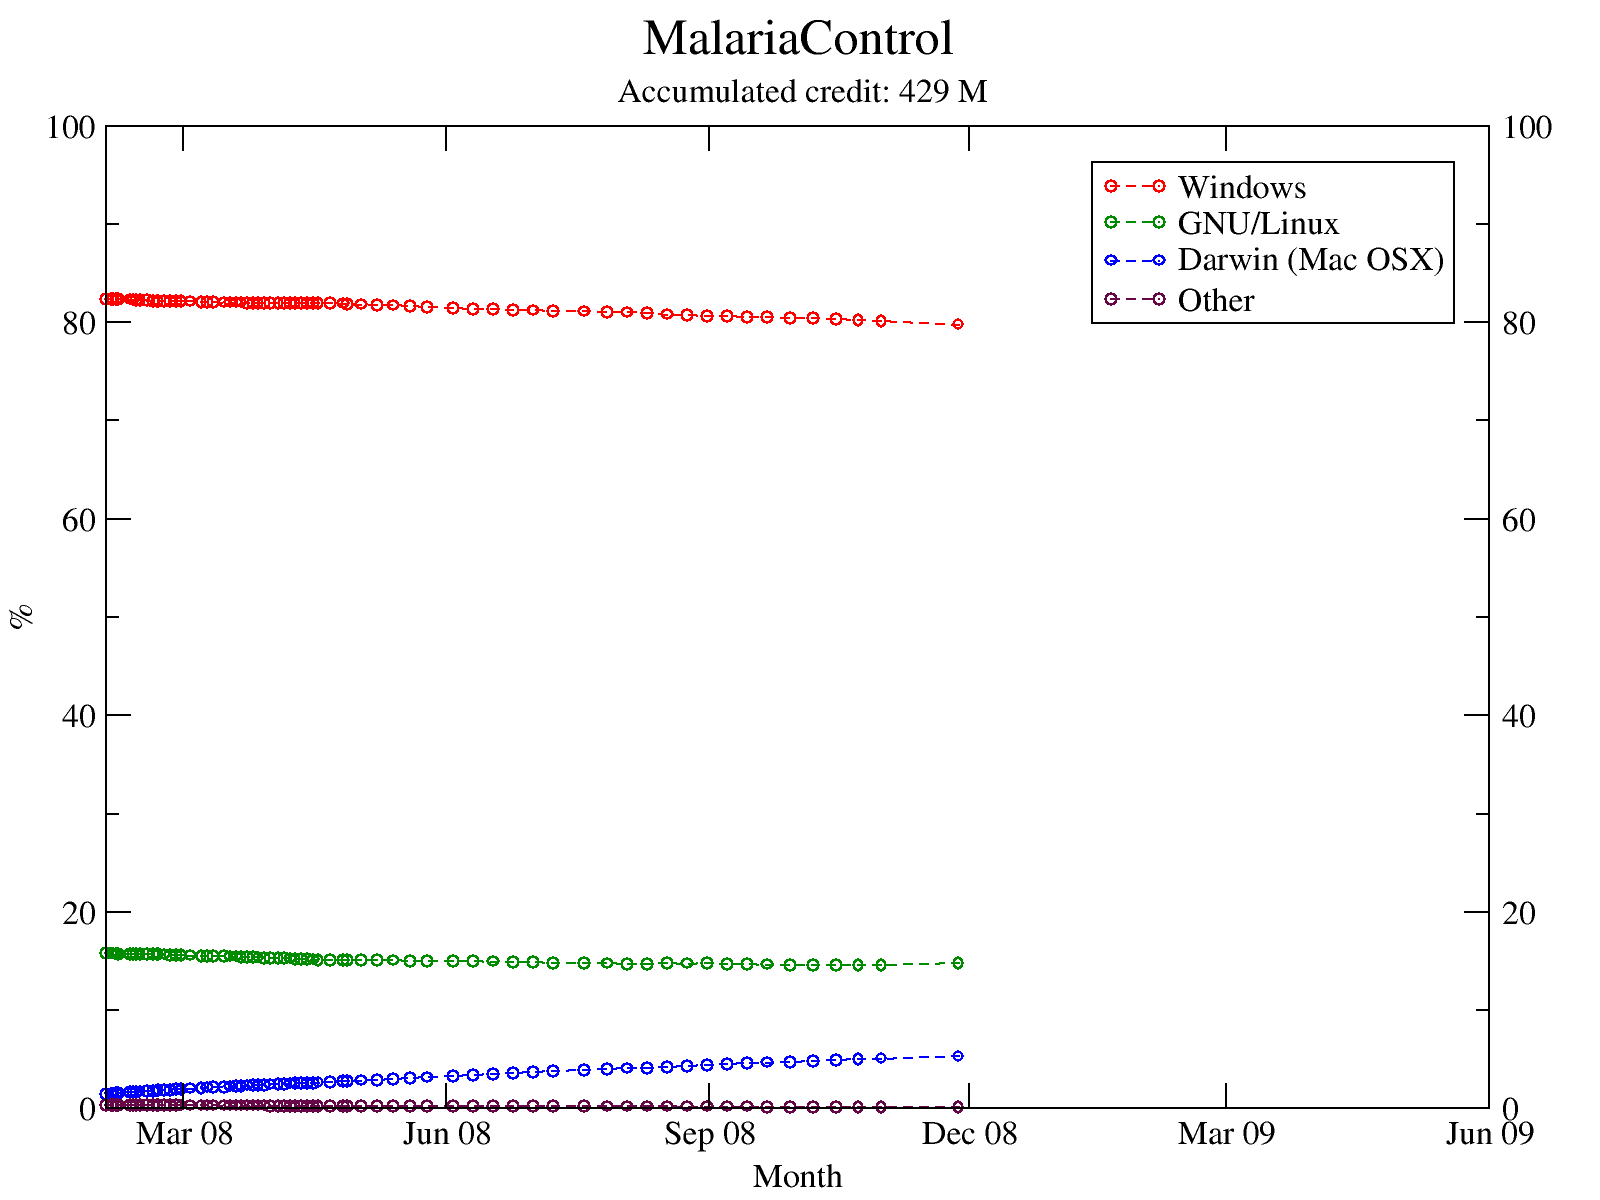
As promised, today I’m showing the plots for MalariaControl. In next issue: POEM@home.

Number of hosts percent evolution for MalariaControl (click to enlarge)

Accumulated credit percent evolution for MalariaControl (click to enlarge)
Permalink
October 30, 2008 at 20:06 pm
· Filed under Free software and related beasts
Hey, October almost passed and I didn’t write the montly report on LWD. I might make it bimontly, to produce less spam in the blog. You can read an intro for my Linux World Domination project in this May 2008 post.
As usual D2D means “days to domination” (the expected time for Windows/Linux shares to cross, counting from Feb 3, 2008), and DD2D means difference (increase/decrease) in D2D, with respect to last report. CLP means “current Linux Percent”, as given by last logged data. The new datum DD means domination day (in YYYY-MM-DD format).
As a new feature, I am now fitting the curves (to predict Windows/Linux crossing) to first degree polynomials, but taking only the last N points so that the [[Coefficient_of_determination#Definitions|coefficient of regression]] is close to 1 (yes, I am being purposely unclear and arbitrary on this subject).
| Project |
D2D |
DD2D |
DD |
CLP |
Confidence % |
| Einstein |
882.1 |
+571.9 |
2011-03-31 |
35.17 (+0.27) |
37.3 |
| MalariaControl |
6890.0 |
+6268.8 |
2027-09-10 |
12.26 (+0.06%) |
0.3 |
| POEM |
3613.9 |
– |
2018-09-21 |
9.81 (+0.05%) |
0.4 |
| QMC |
>10k |
– |
– |
7.88 (+0.0%) |
– |
| Rosetta |
>10k |
– |
– |
7.91 (+0.11%) |
– |
| SETI |
>10k |
– |
– |
7.86 (+0.03) |
– |
| Spinhenge |
>10k |
– |
– |
3.21 (+0.2%) |
– |
OK, the data seems discouraging. The crossing day (DD) seems to be further away every month, instead of closer. Recall however that the only (half) reliable data are the current (and past) percents. All the rest is speculation, and the fits change wildly depending on the function used to make them, and the number of points fit.
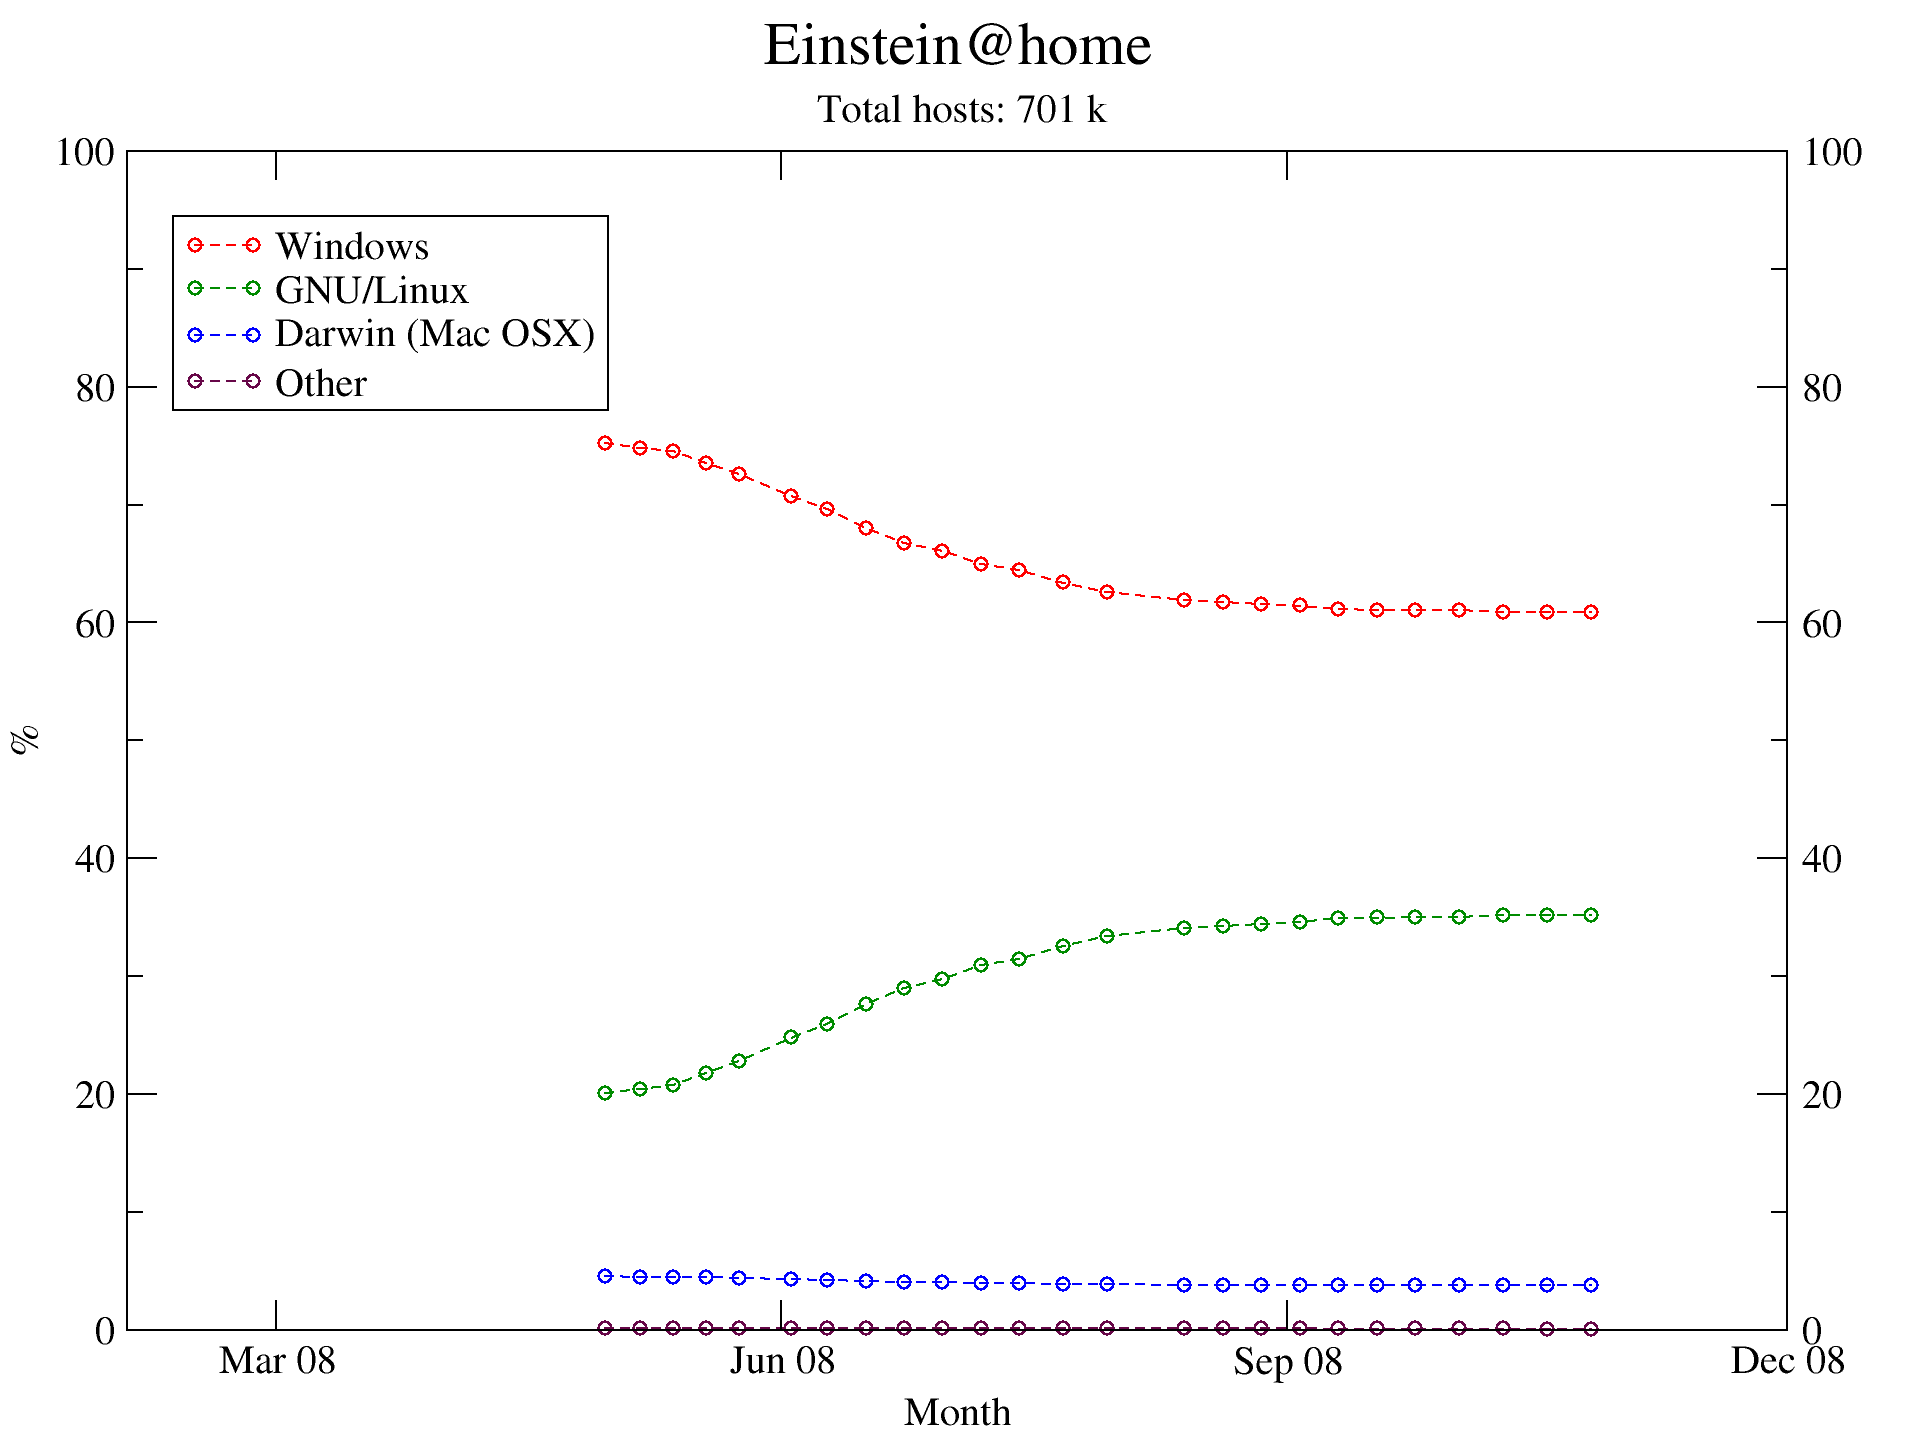
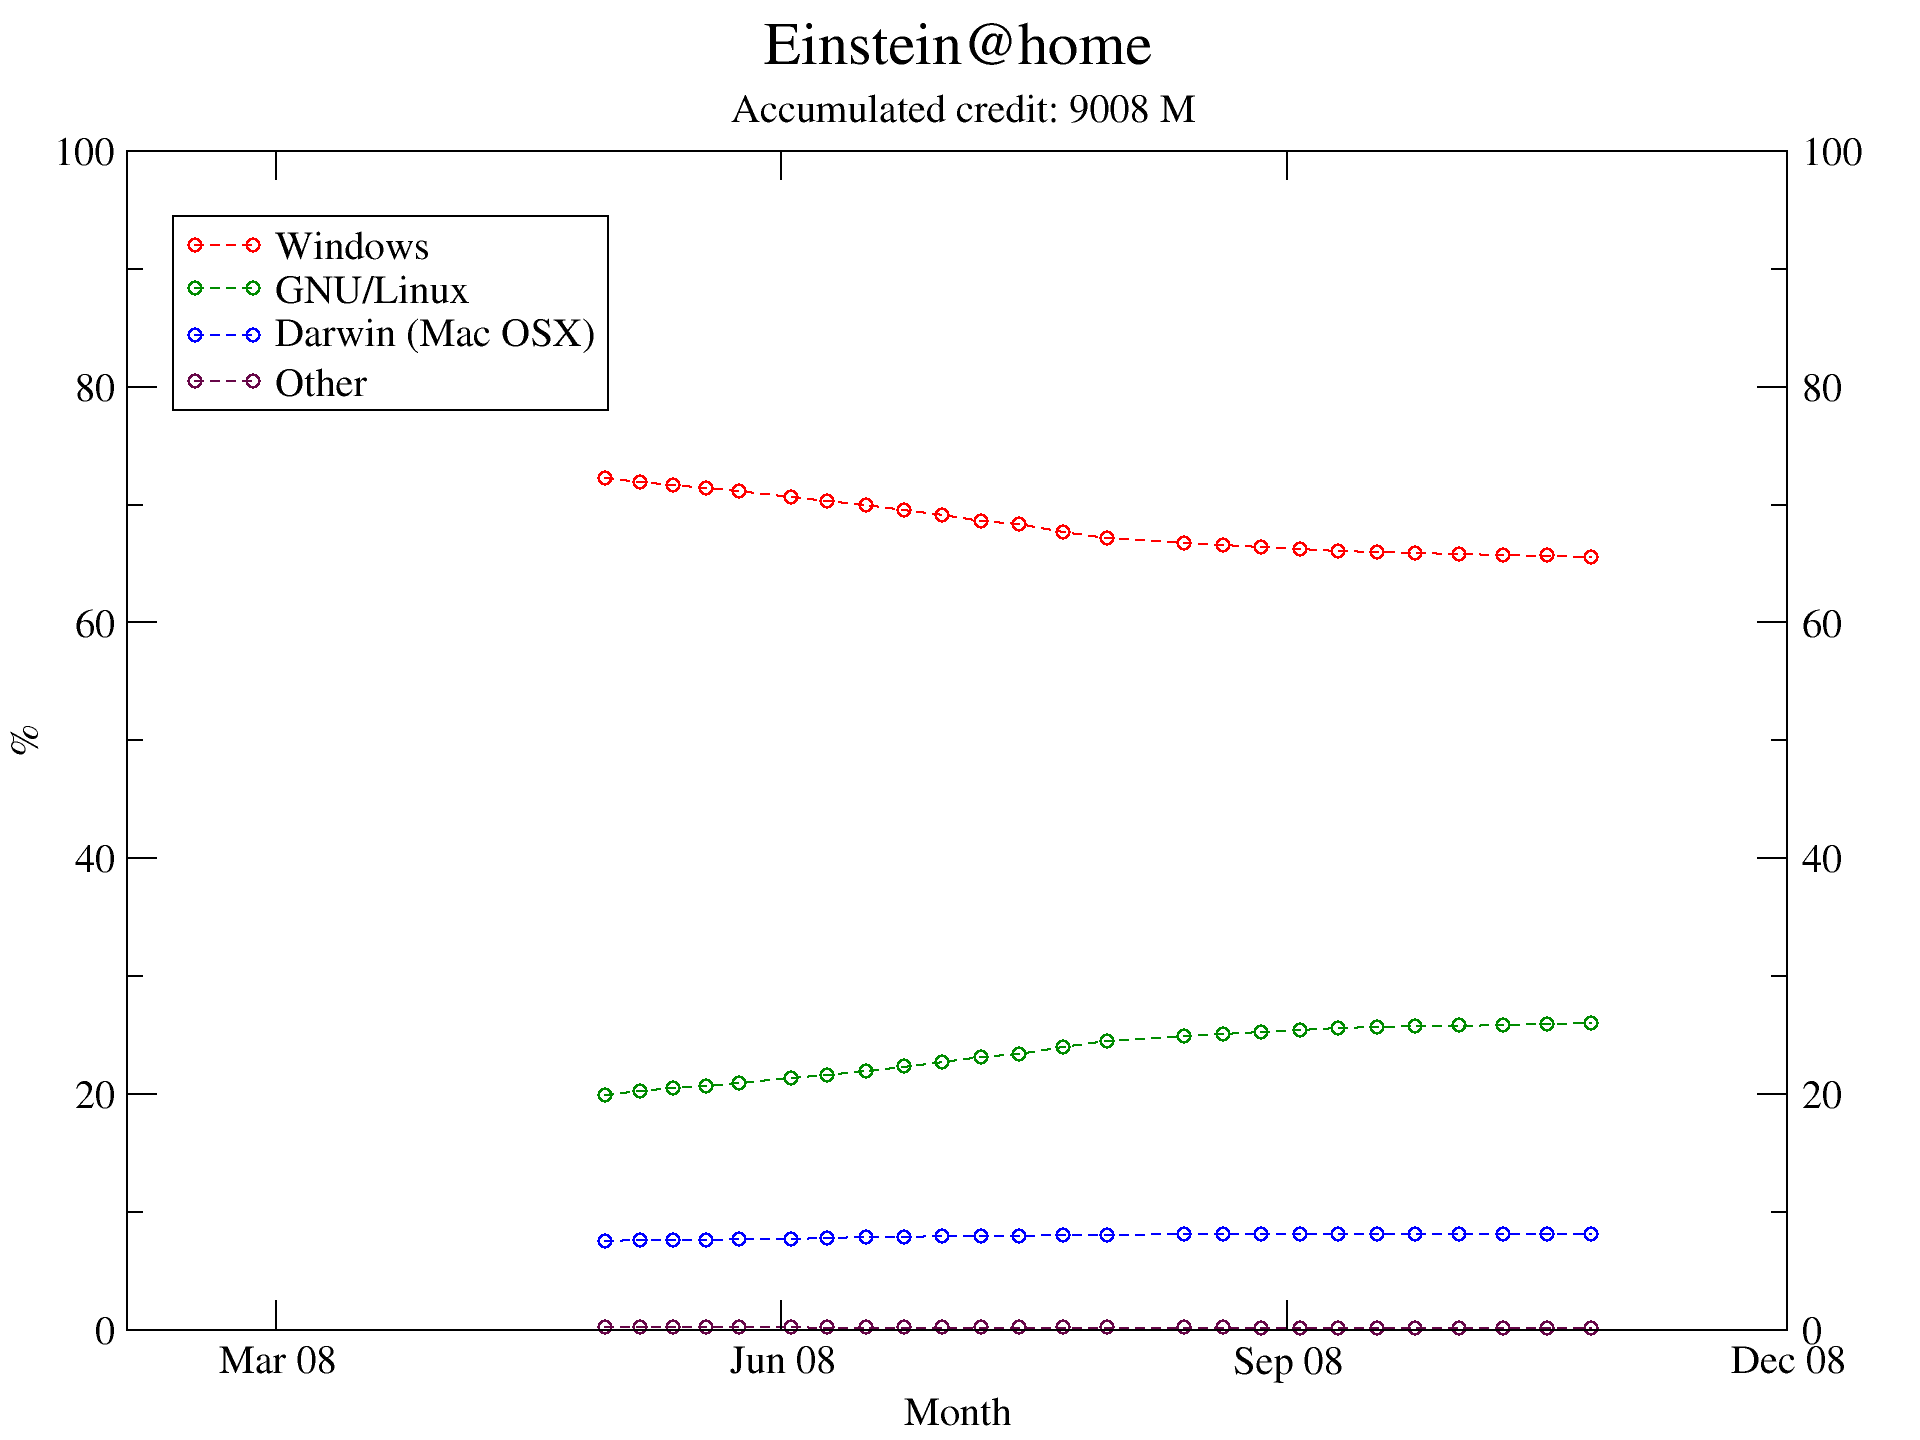
Starting with this month’s issue, I might post pictures of the evolution plots. Today I’m showing the plots for Einstein@home. Next month: Malaria@home.

Number of hosts percent evolution for Einstein@home (click to enlarge)

Accumulated credit percent evolution for Einstein@home (click to enlarge)
Permalink